Stage II - Building the SOC
Log Analytics and Microsoft Sentinel (SIEM) Setup + Data Ingestion
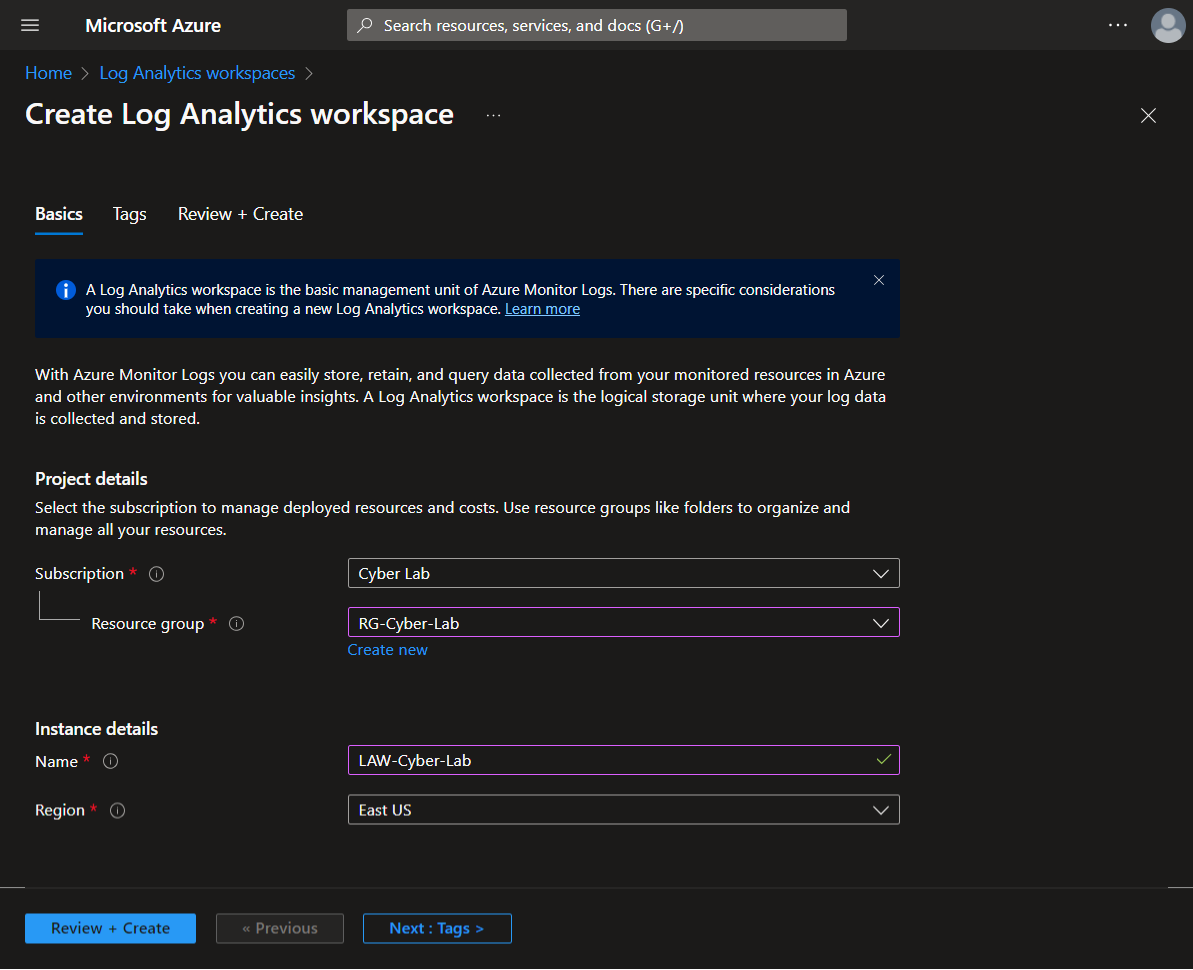
Create Log Analytics Workspace.
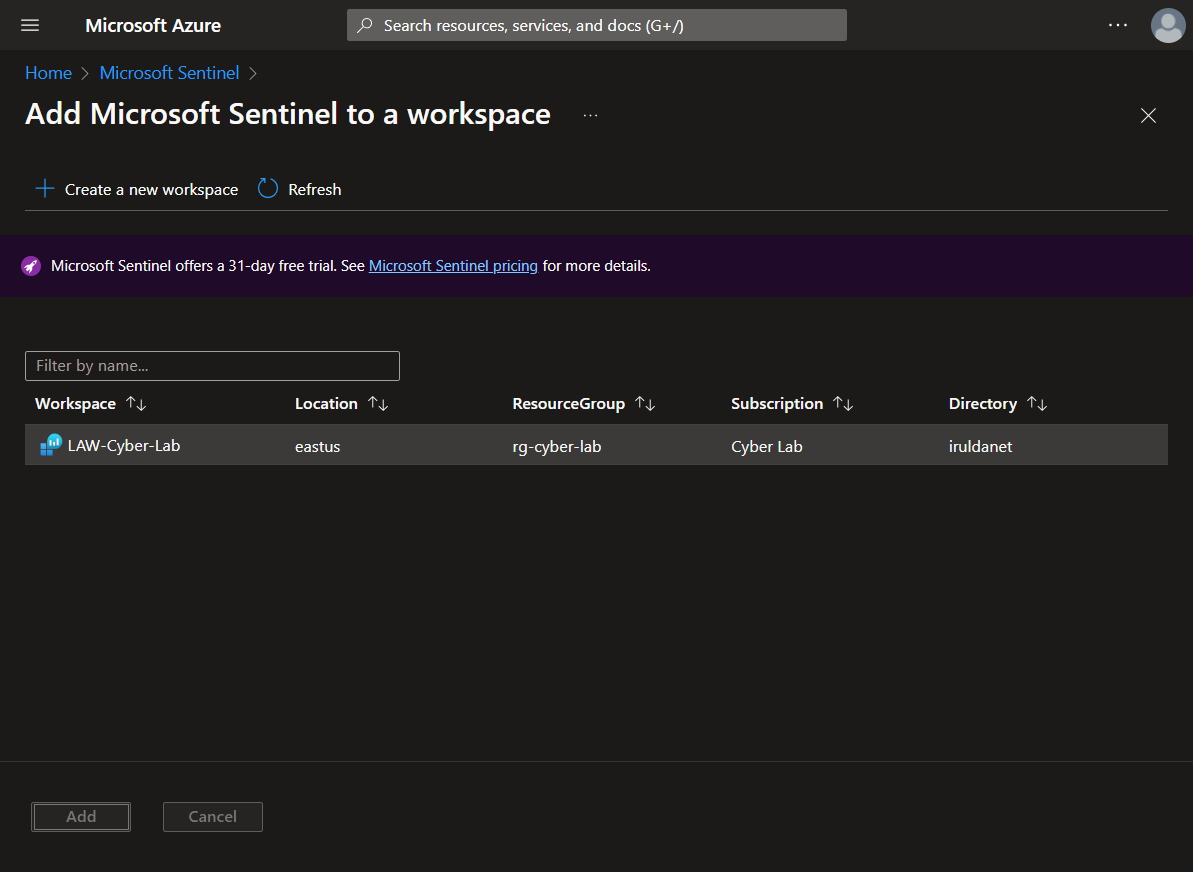
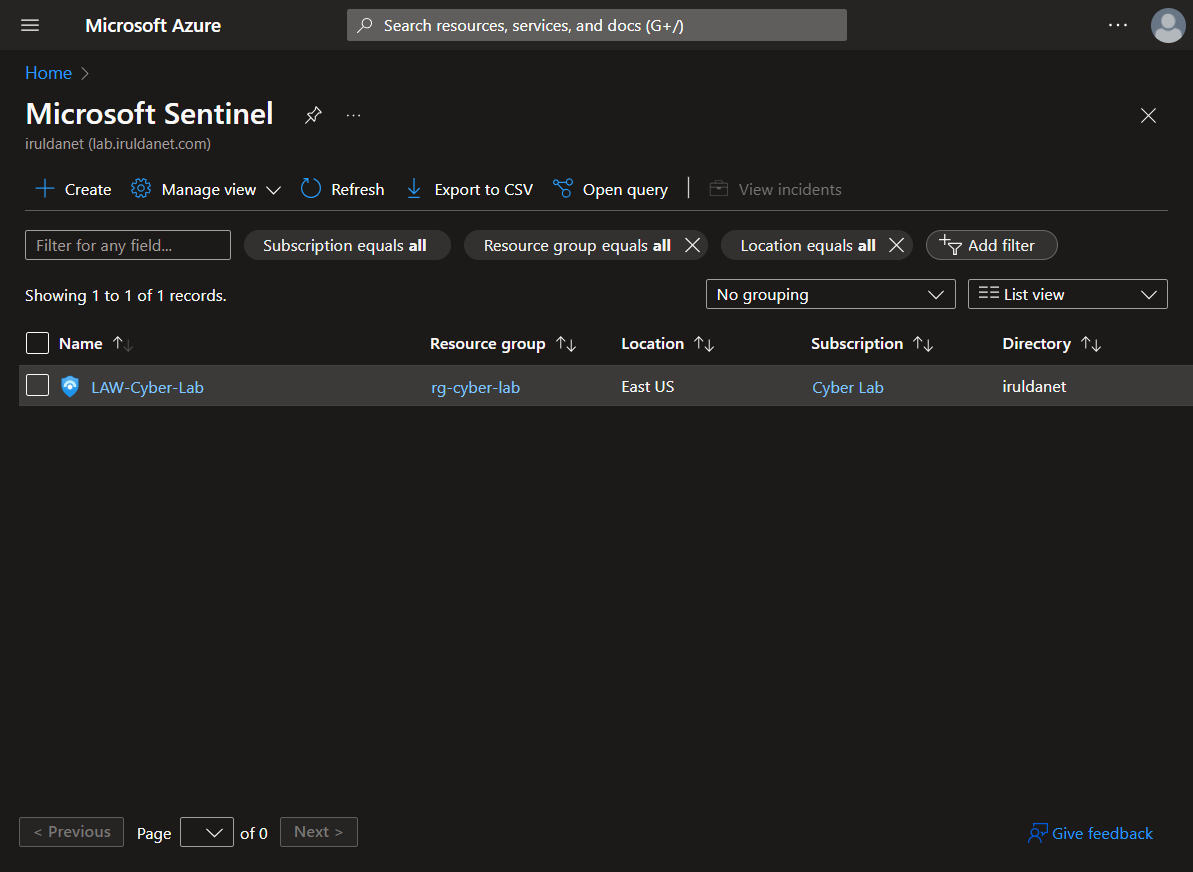
Add Sentinel to the workspace.
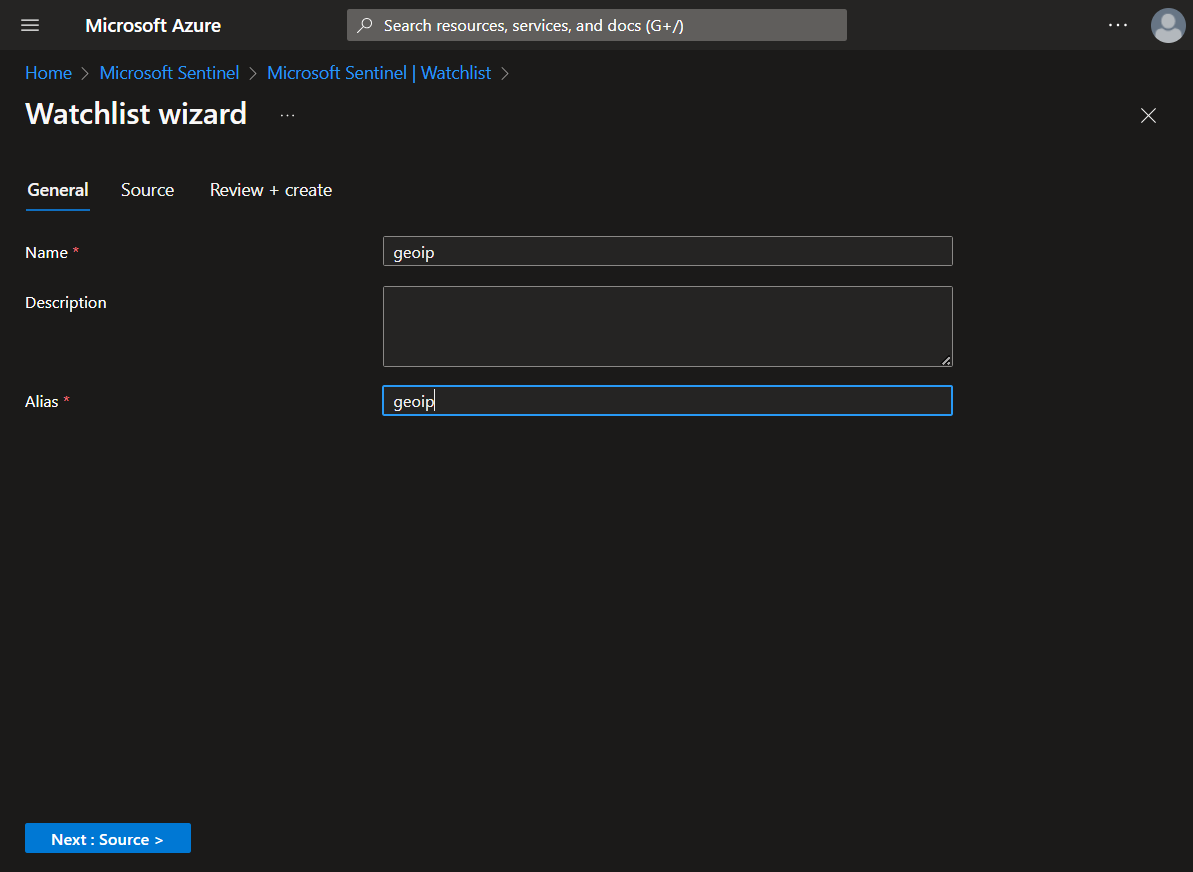
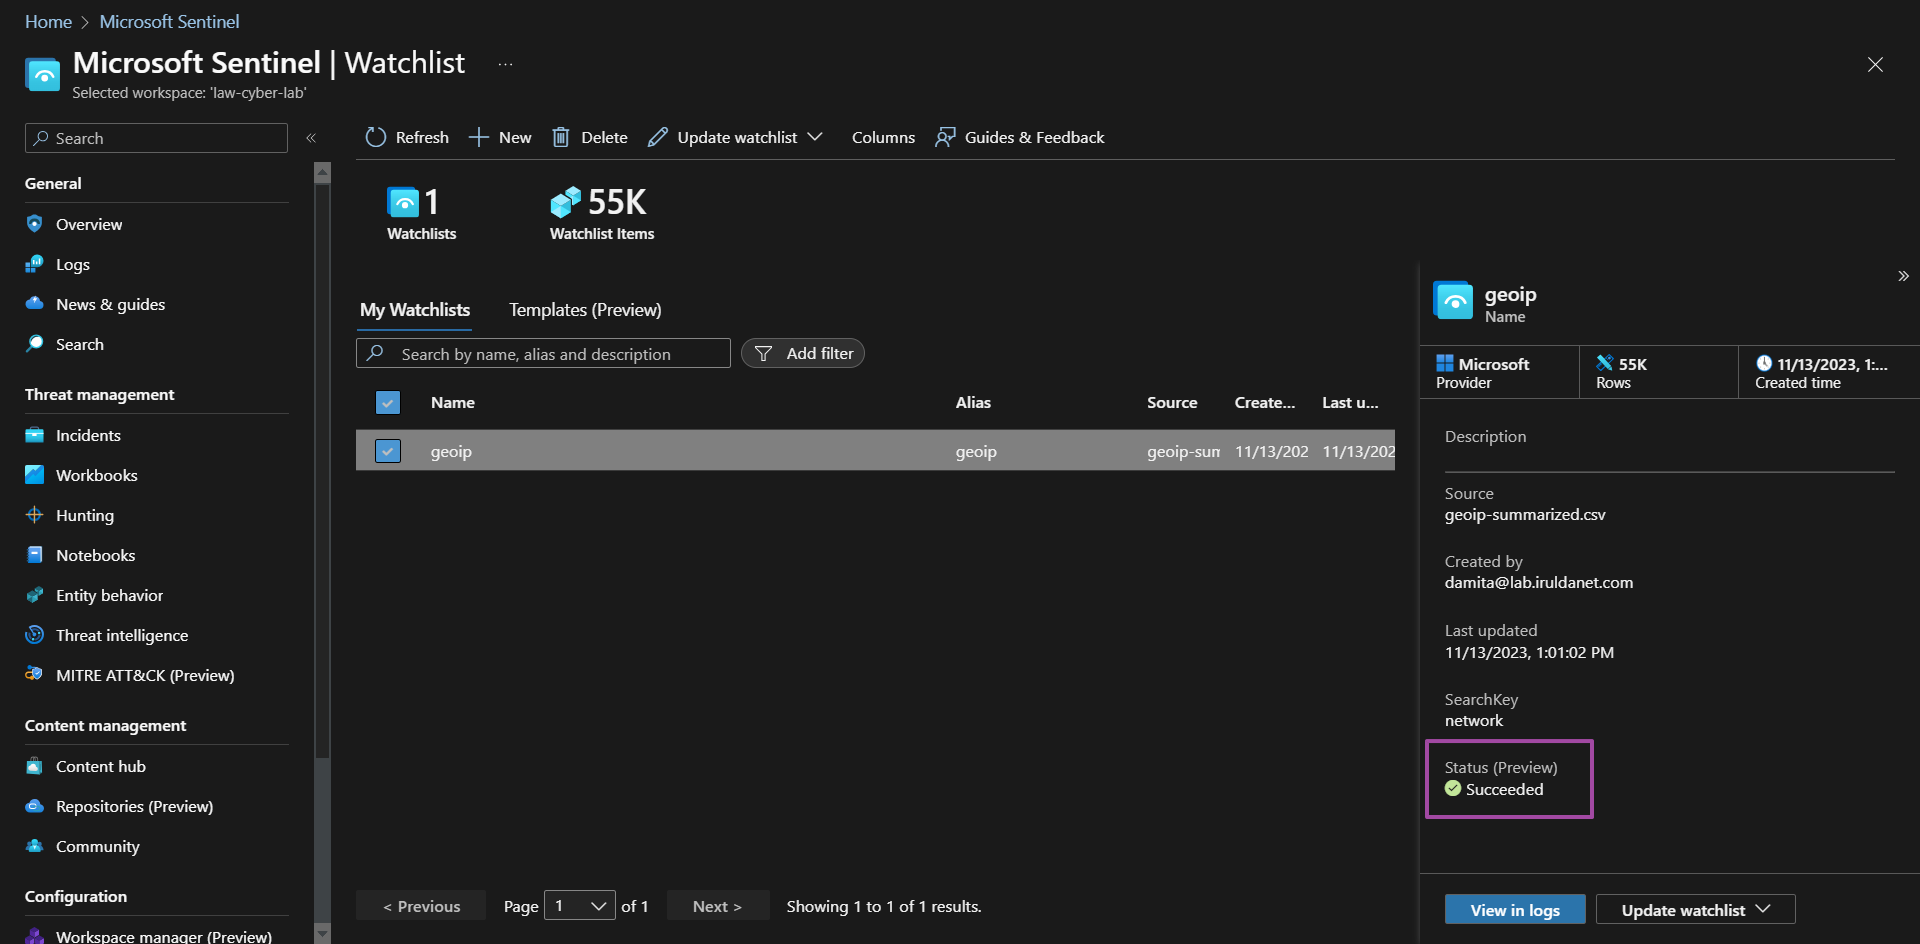
Create Sentinel Watchlist
In Sentinel, a new watchlist for Geo IP Data. This watchlist will help us correlate security events to geographic locations later in the lab.
Upload the geoIP data and set the search key.
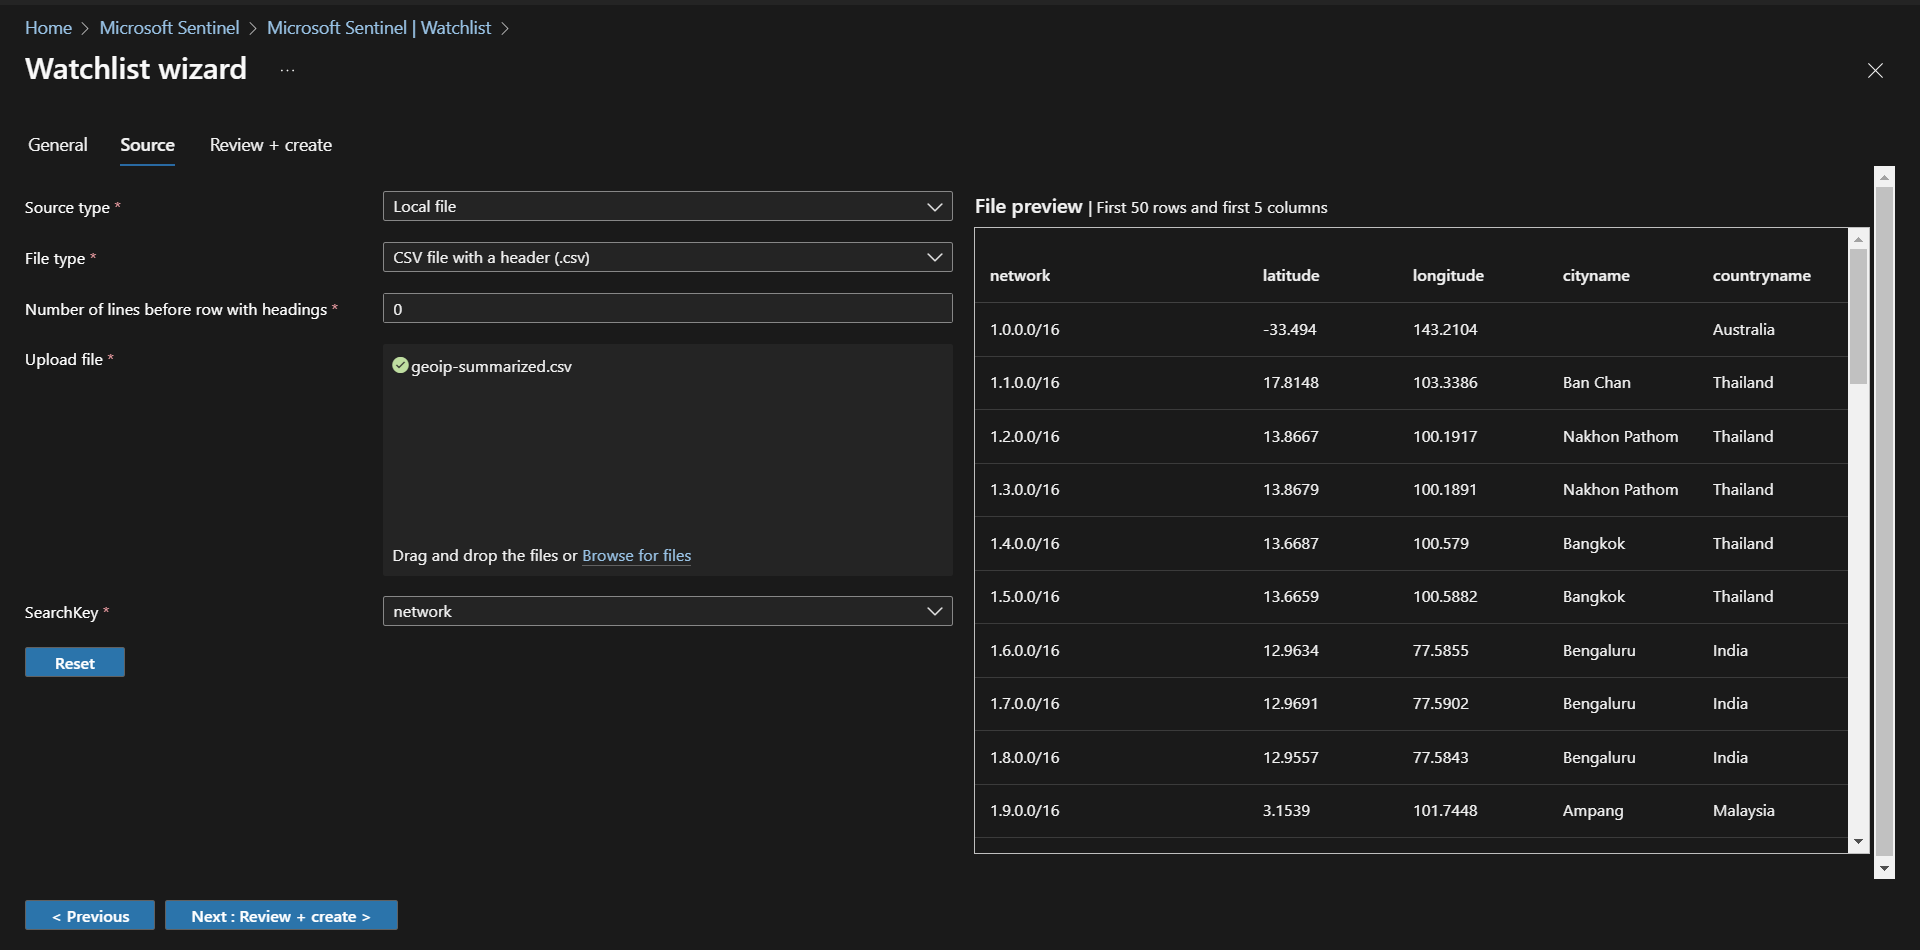
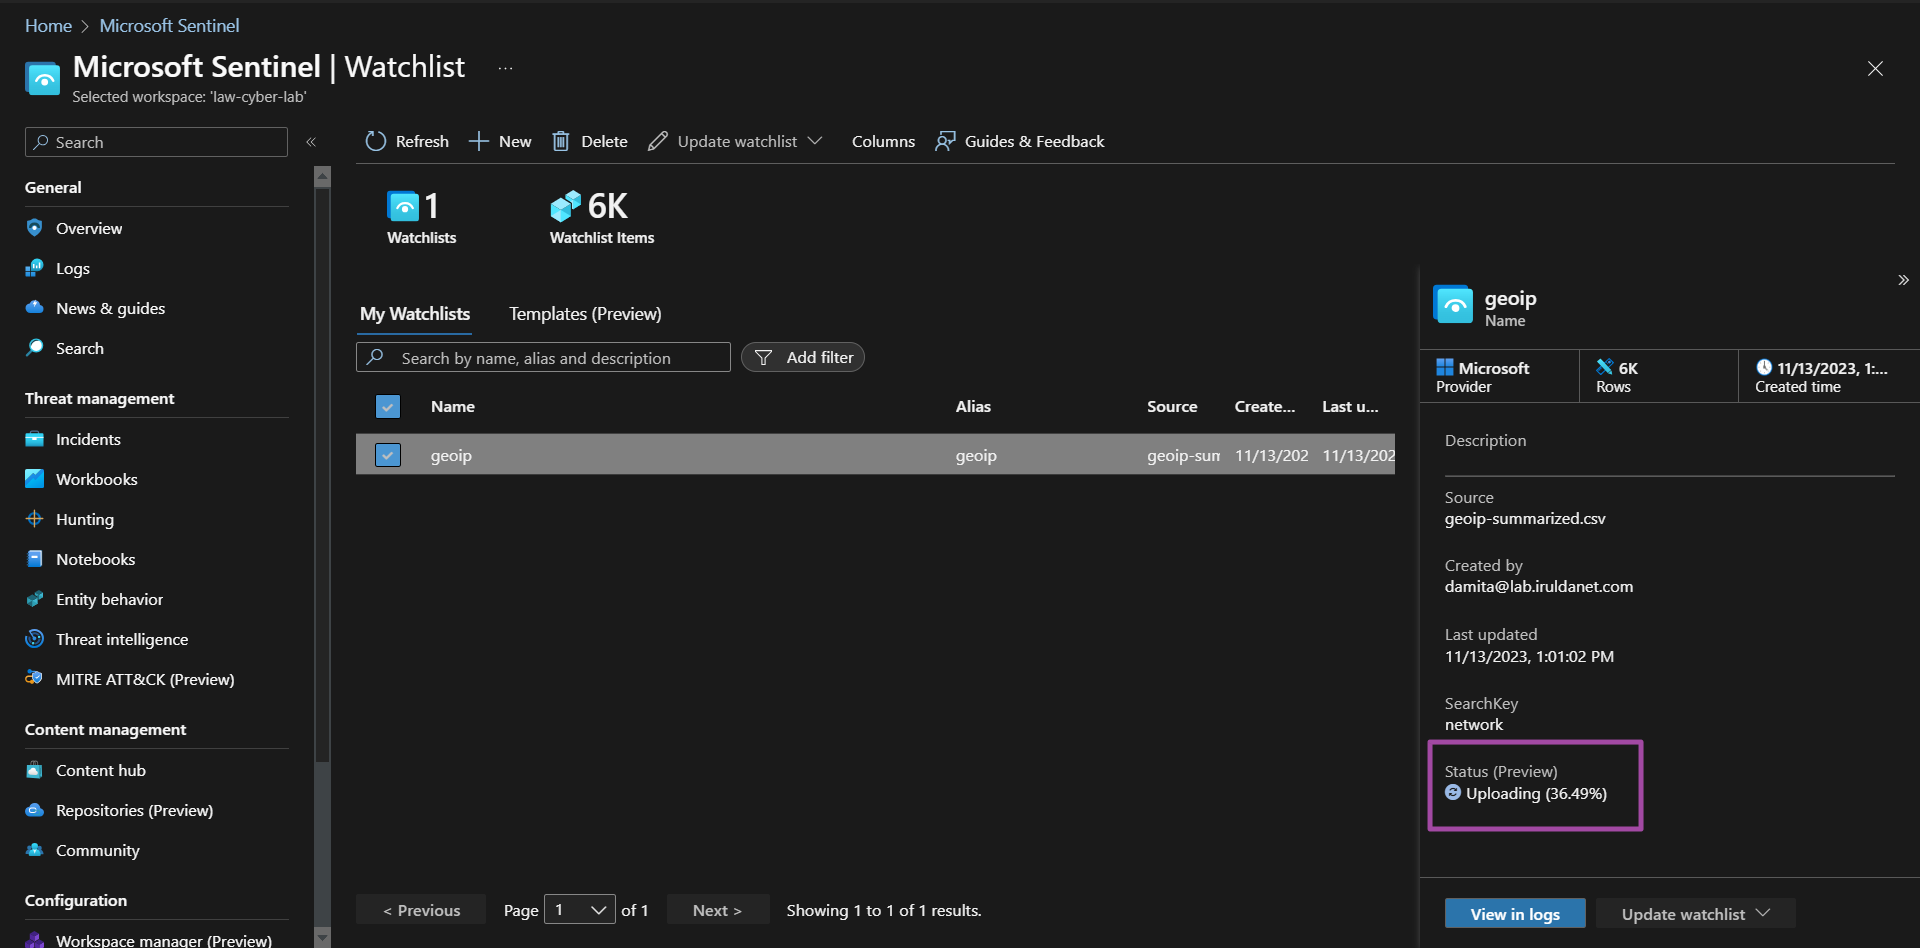
Once the watchlist begins uploading, sentinel will start ingesting the data and it will be available for query, even before ingestion completes.
Querying GeoIP data using KQL.
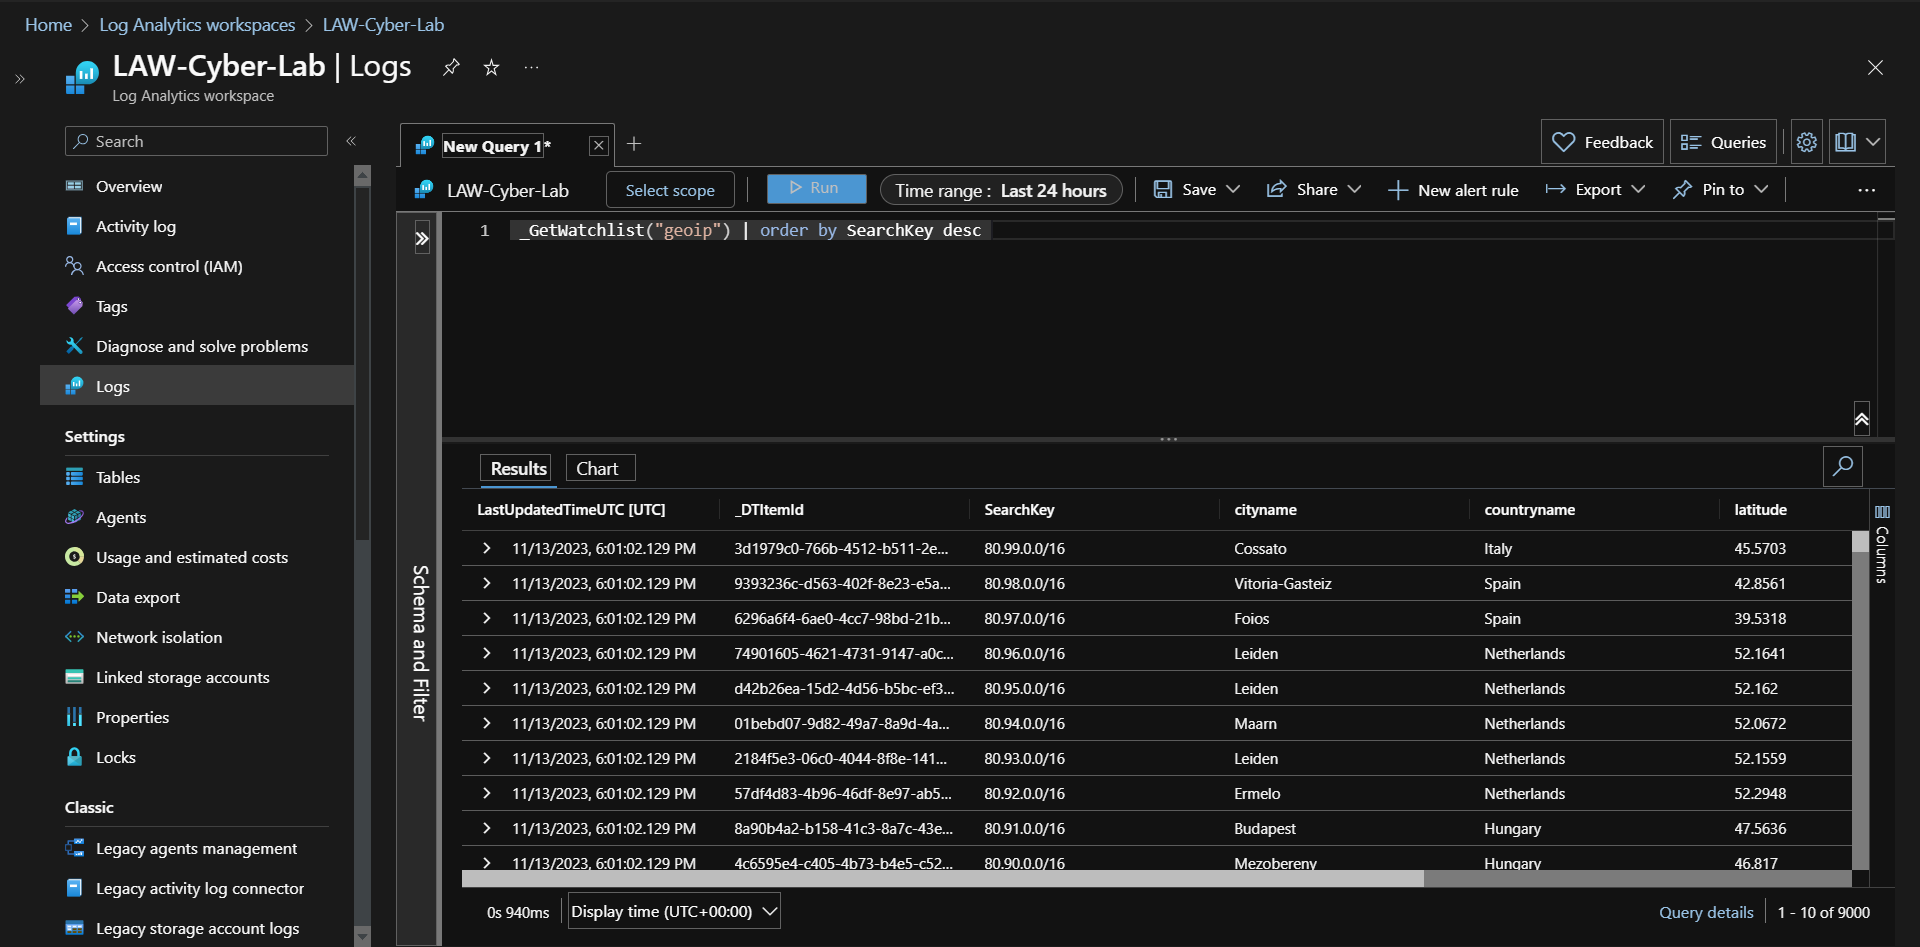
Upload complete.
Enable Microsoft Defender for Cloud
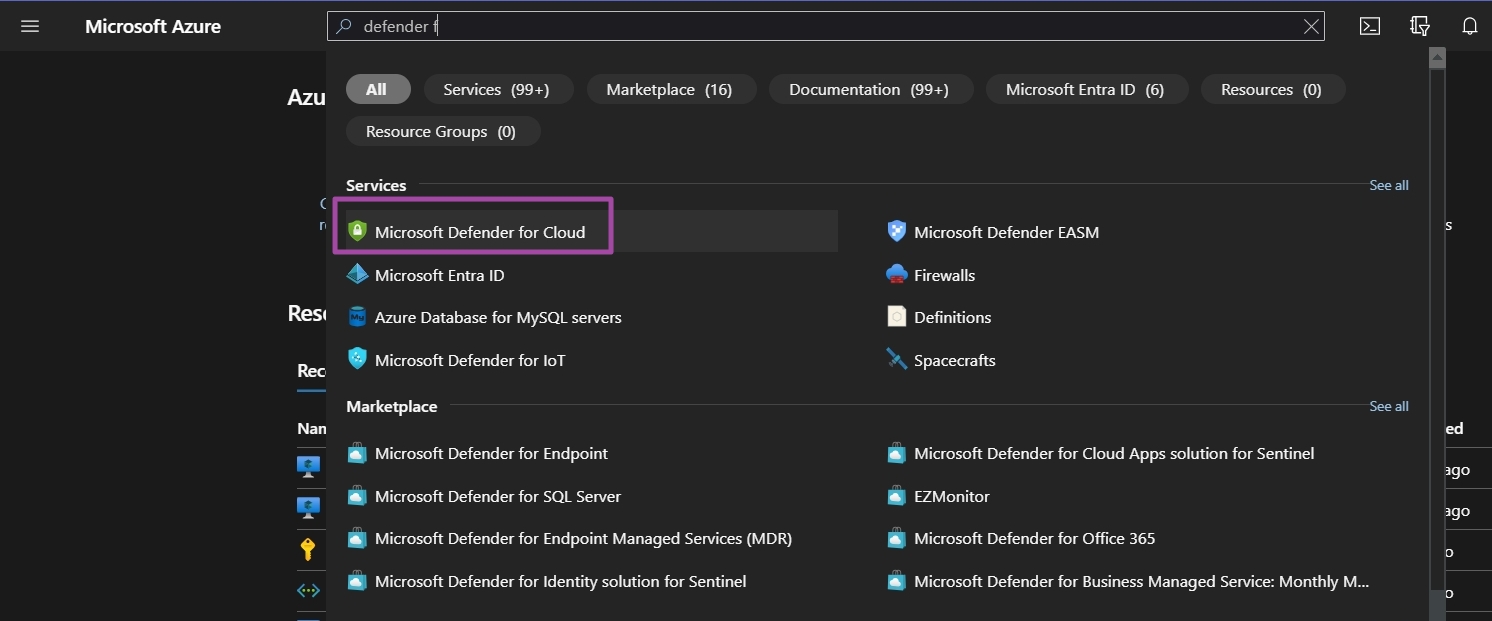
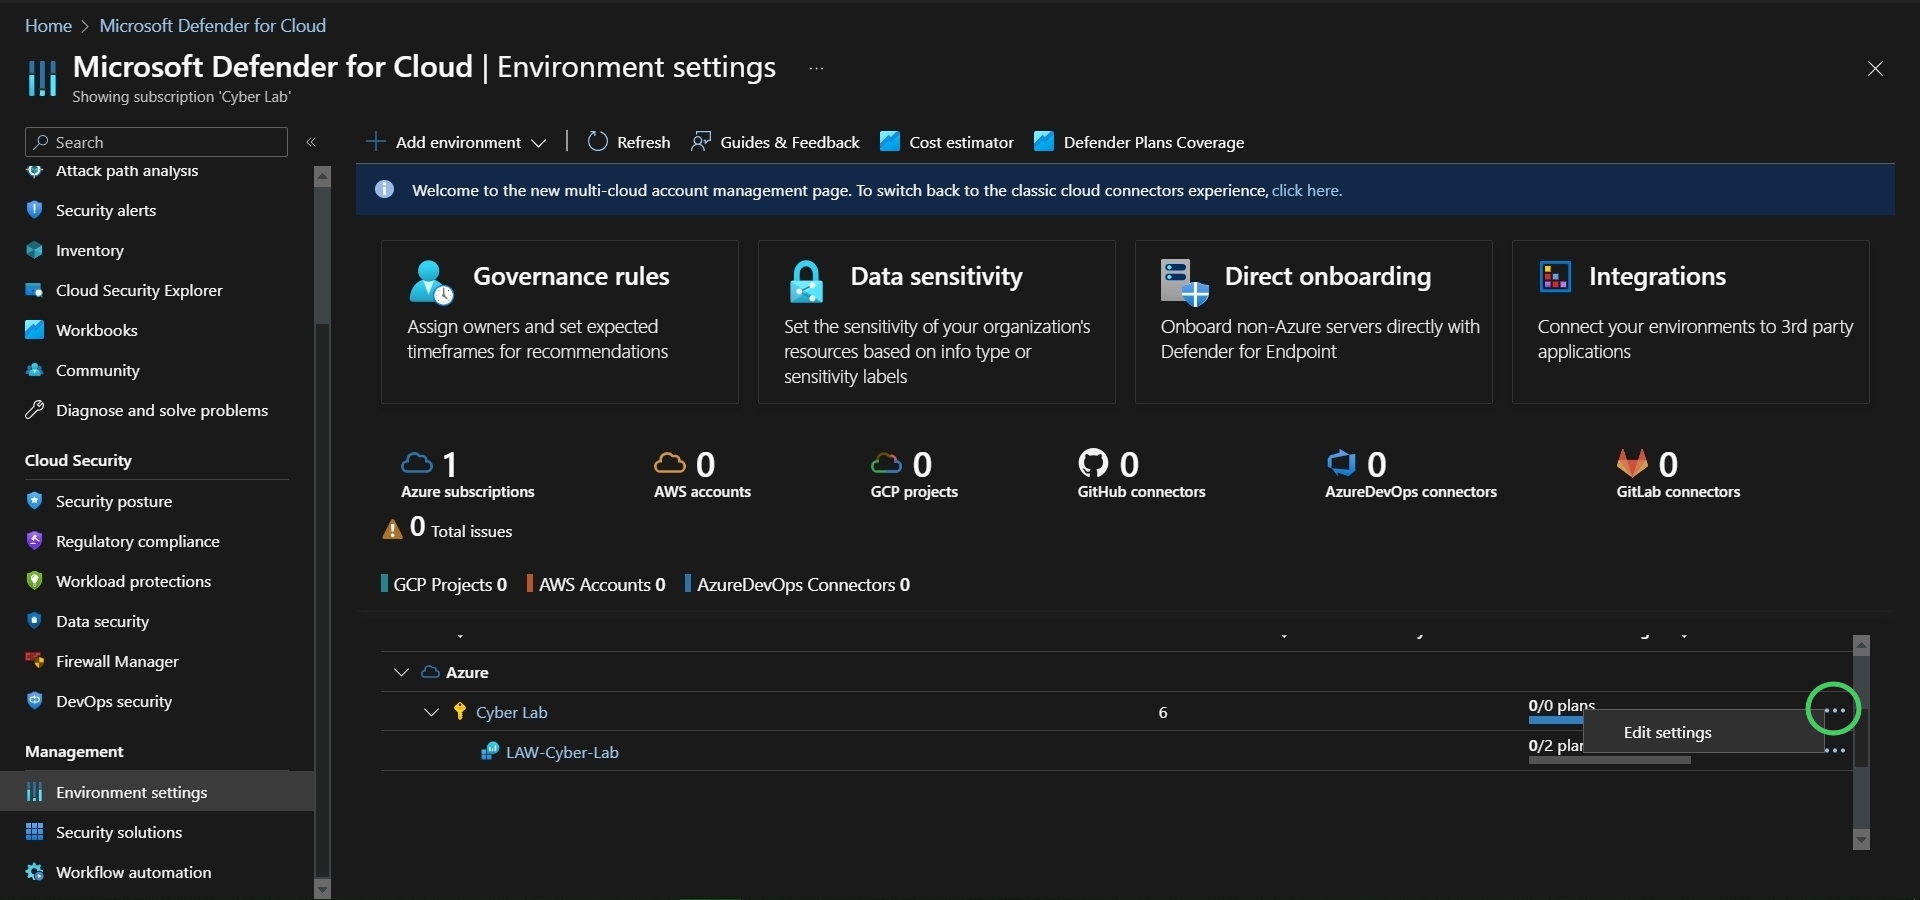
Open MDC:
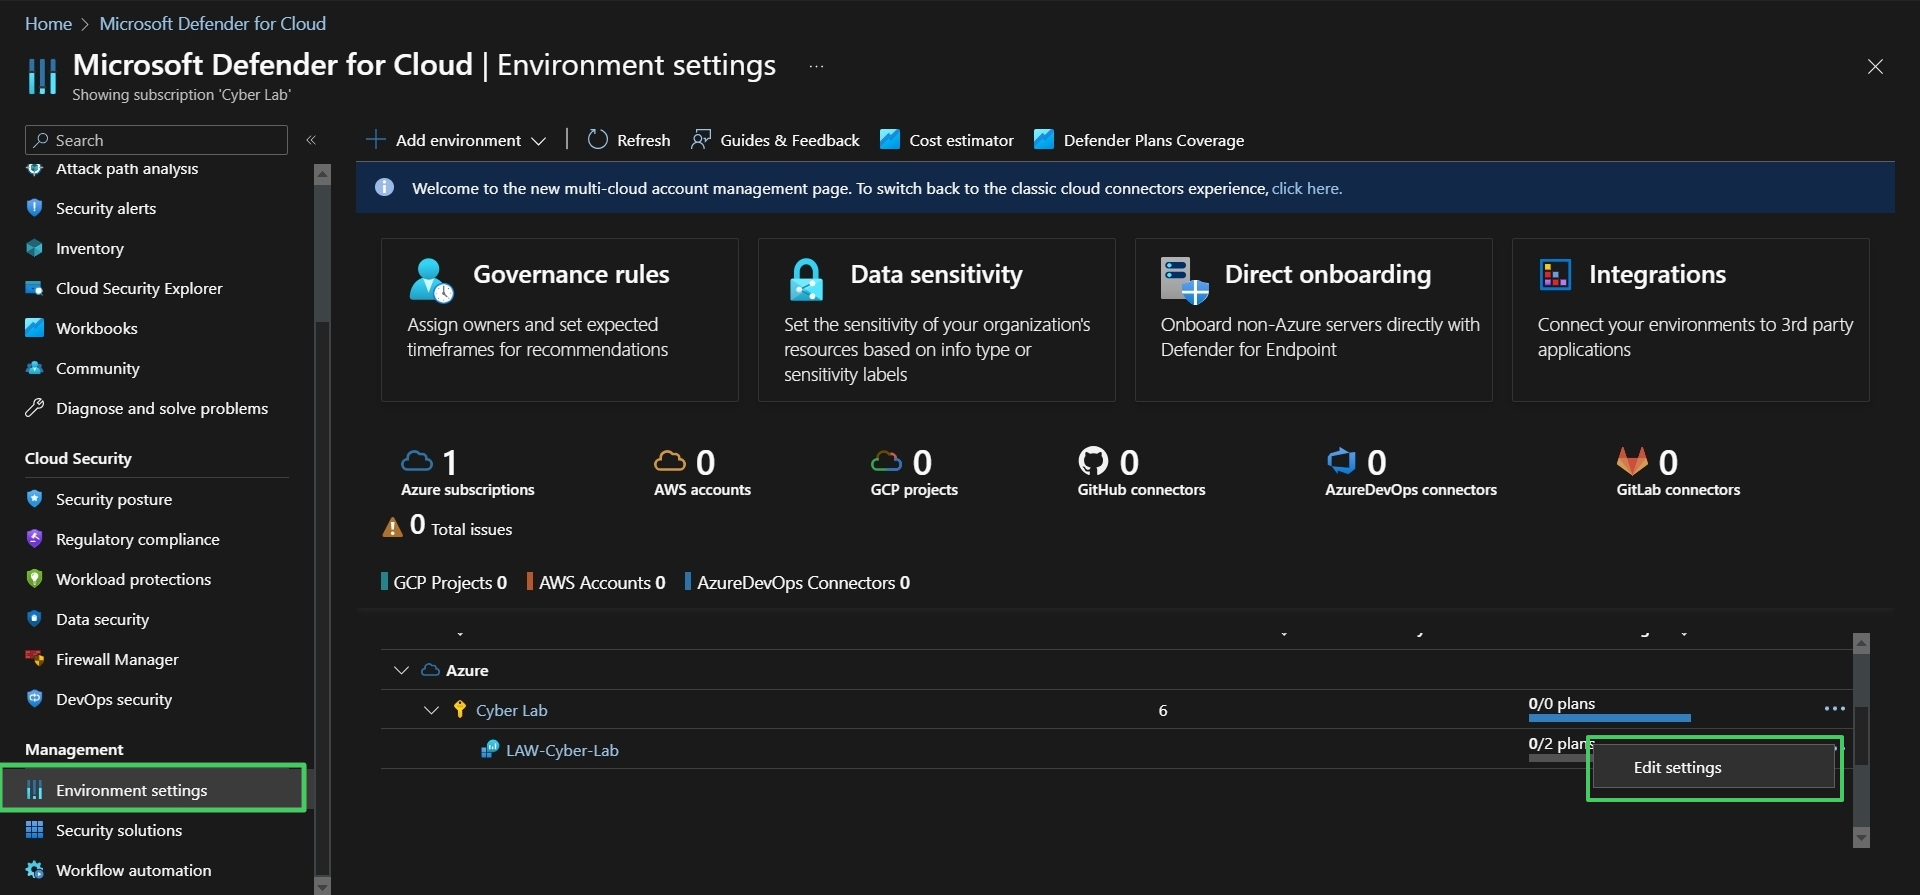
Go to Environment Settings > Drill down to the LAW > click the three dots corresponding to LAW > Edit Settings
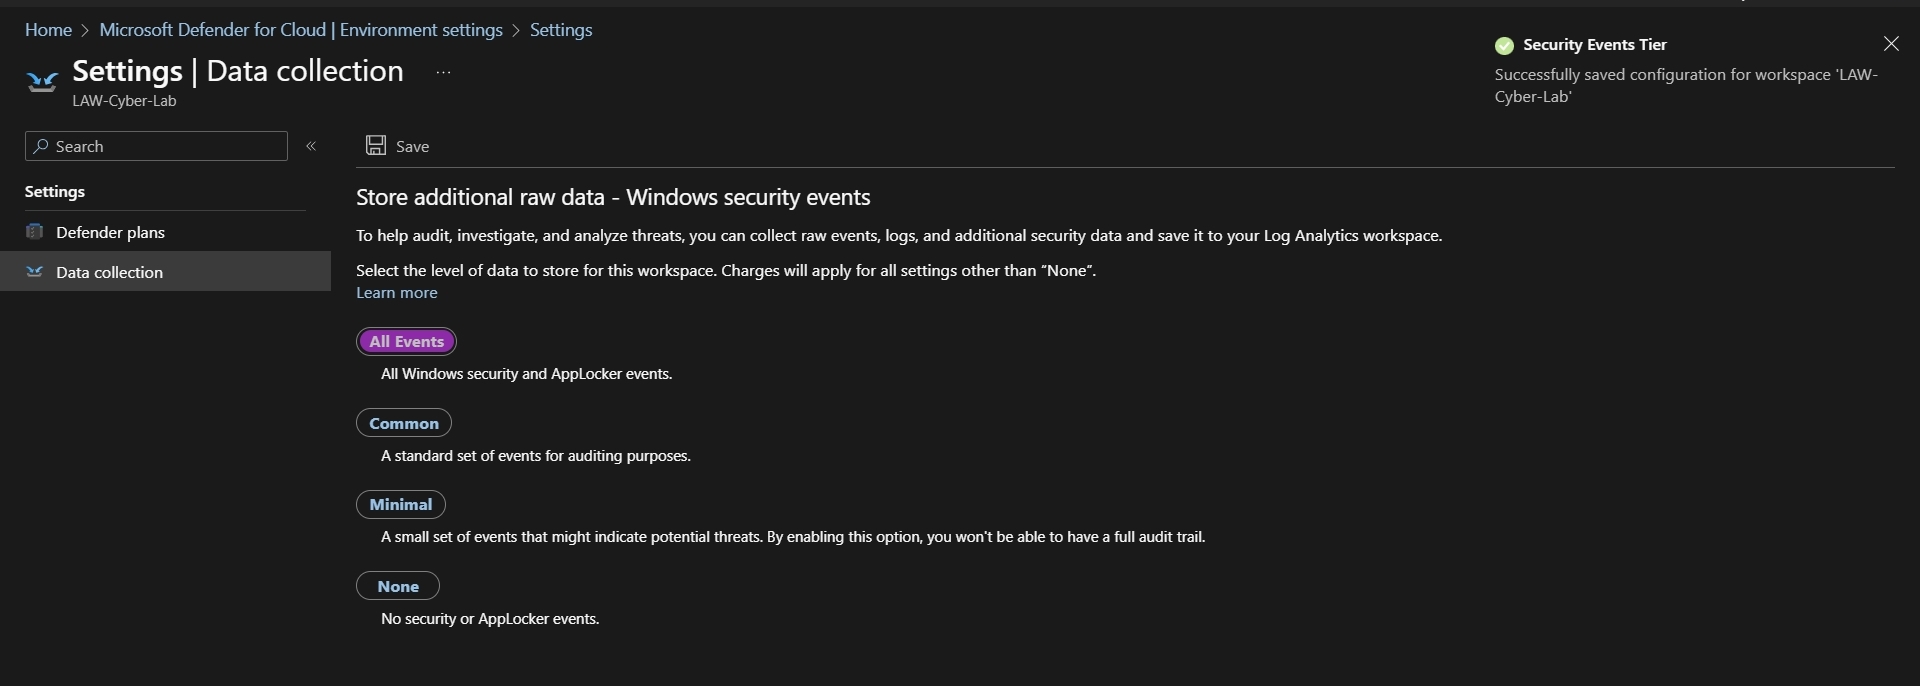
Enable Data Collection Click Data Collection (in sidebar) > All Events > Save
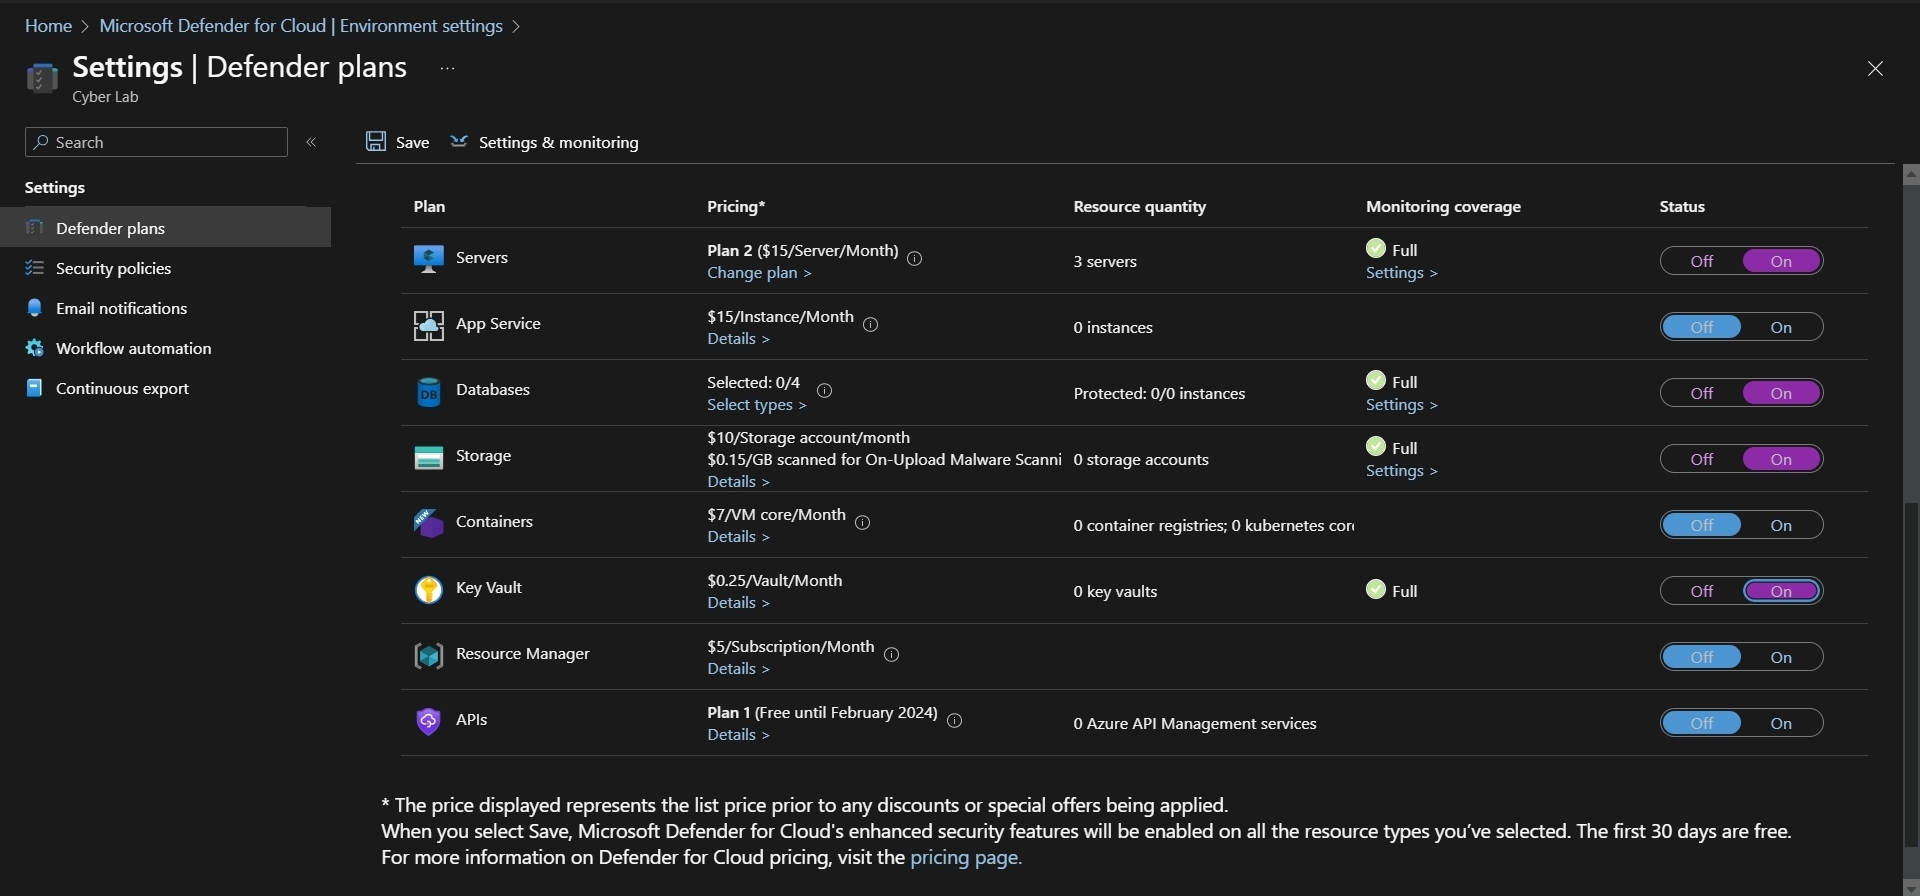
Back in MDC, go to Environment Settings > click the three dots corresponding to the Subscription > Edit Settings
Under Defender Plans, toggle ON: Servers, Databases, Storage and Key Vault
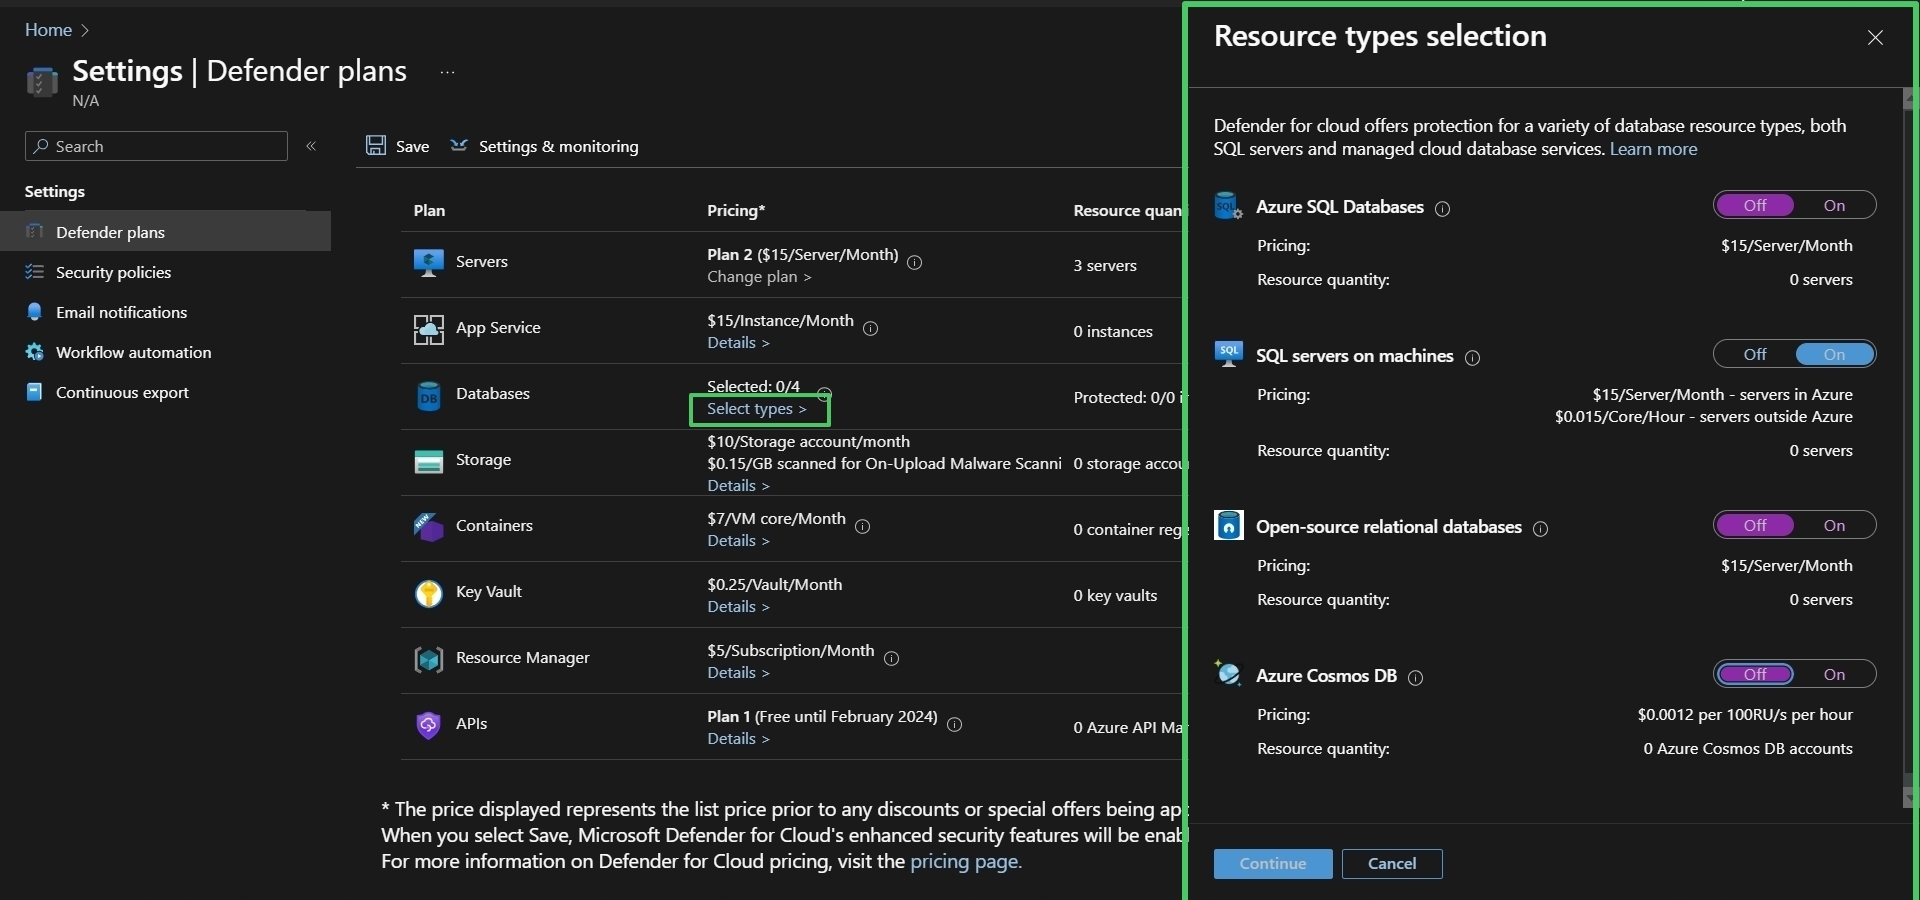
Next to Databases > Select Types > make sure 'SQL servers on Machines' is toggled ON, all else toggled OFF > Continue
Next to Servers > Under Monitoring Coverage, click Settings > make sure everything is toggled ON
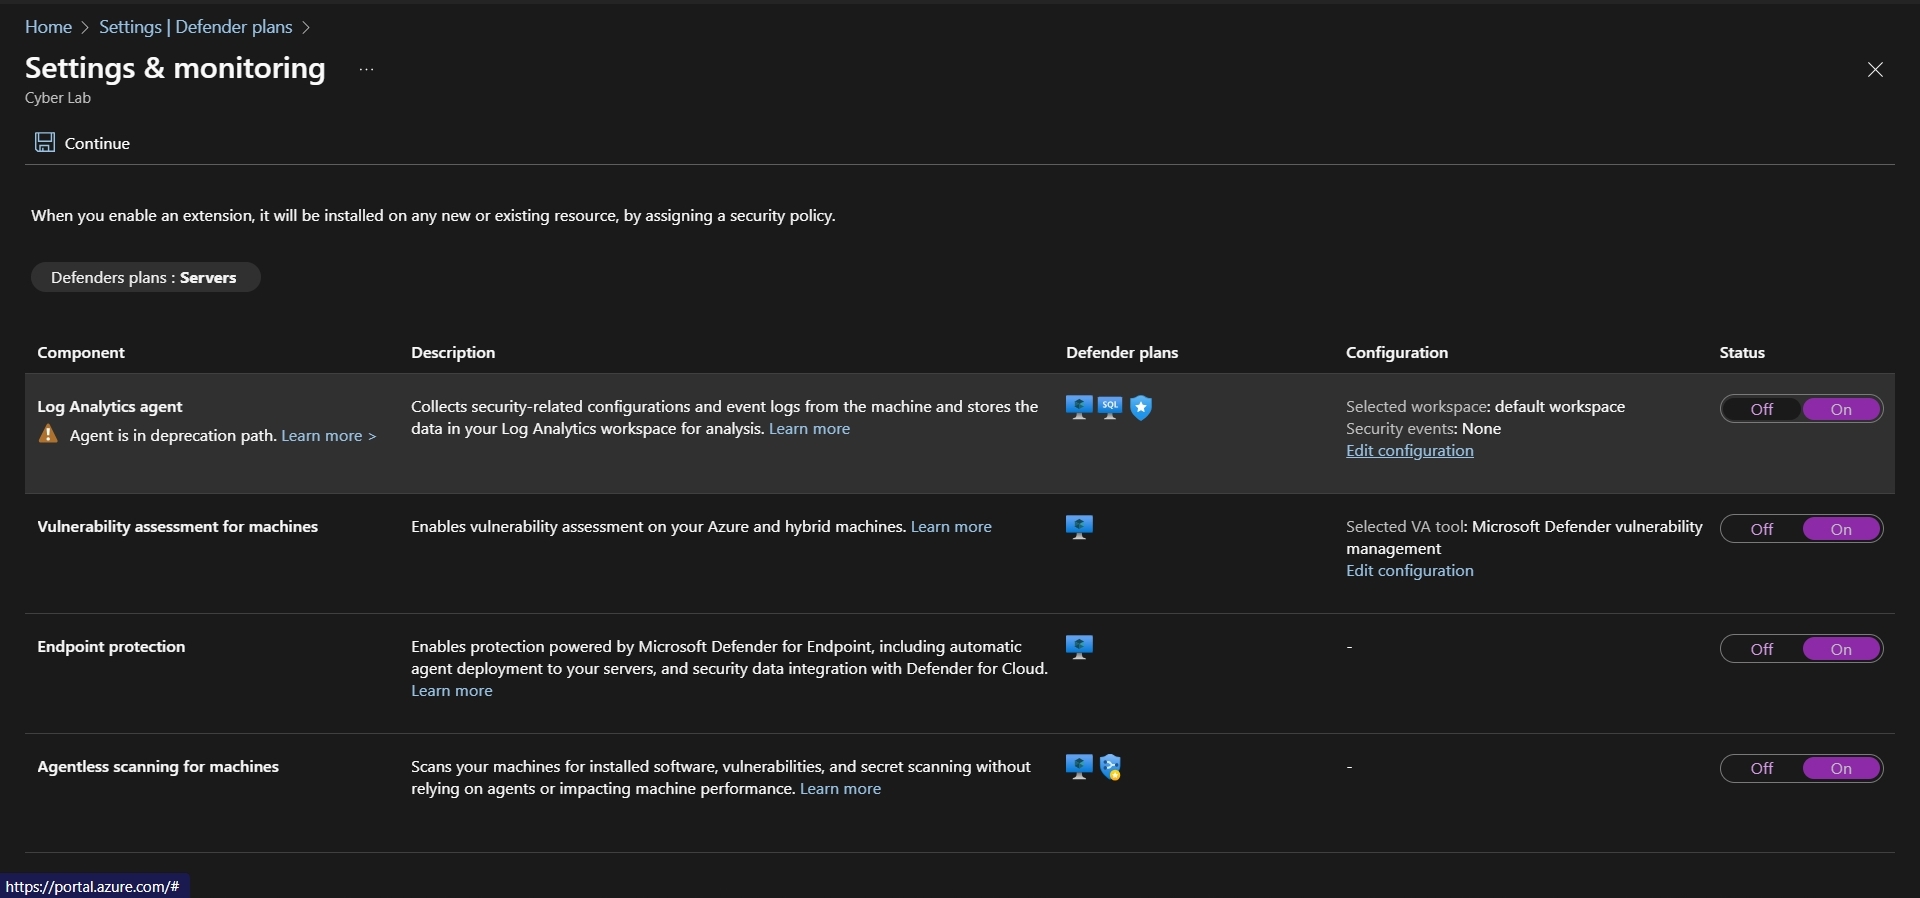
Next to Log Analytics Agent > under Configuration > Edit Configuration. Change the workspace selection to Custom and select the LAW created and configured earlier > Apply > Continue > Save
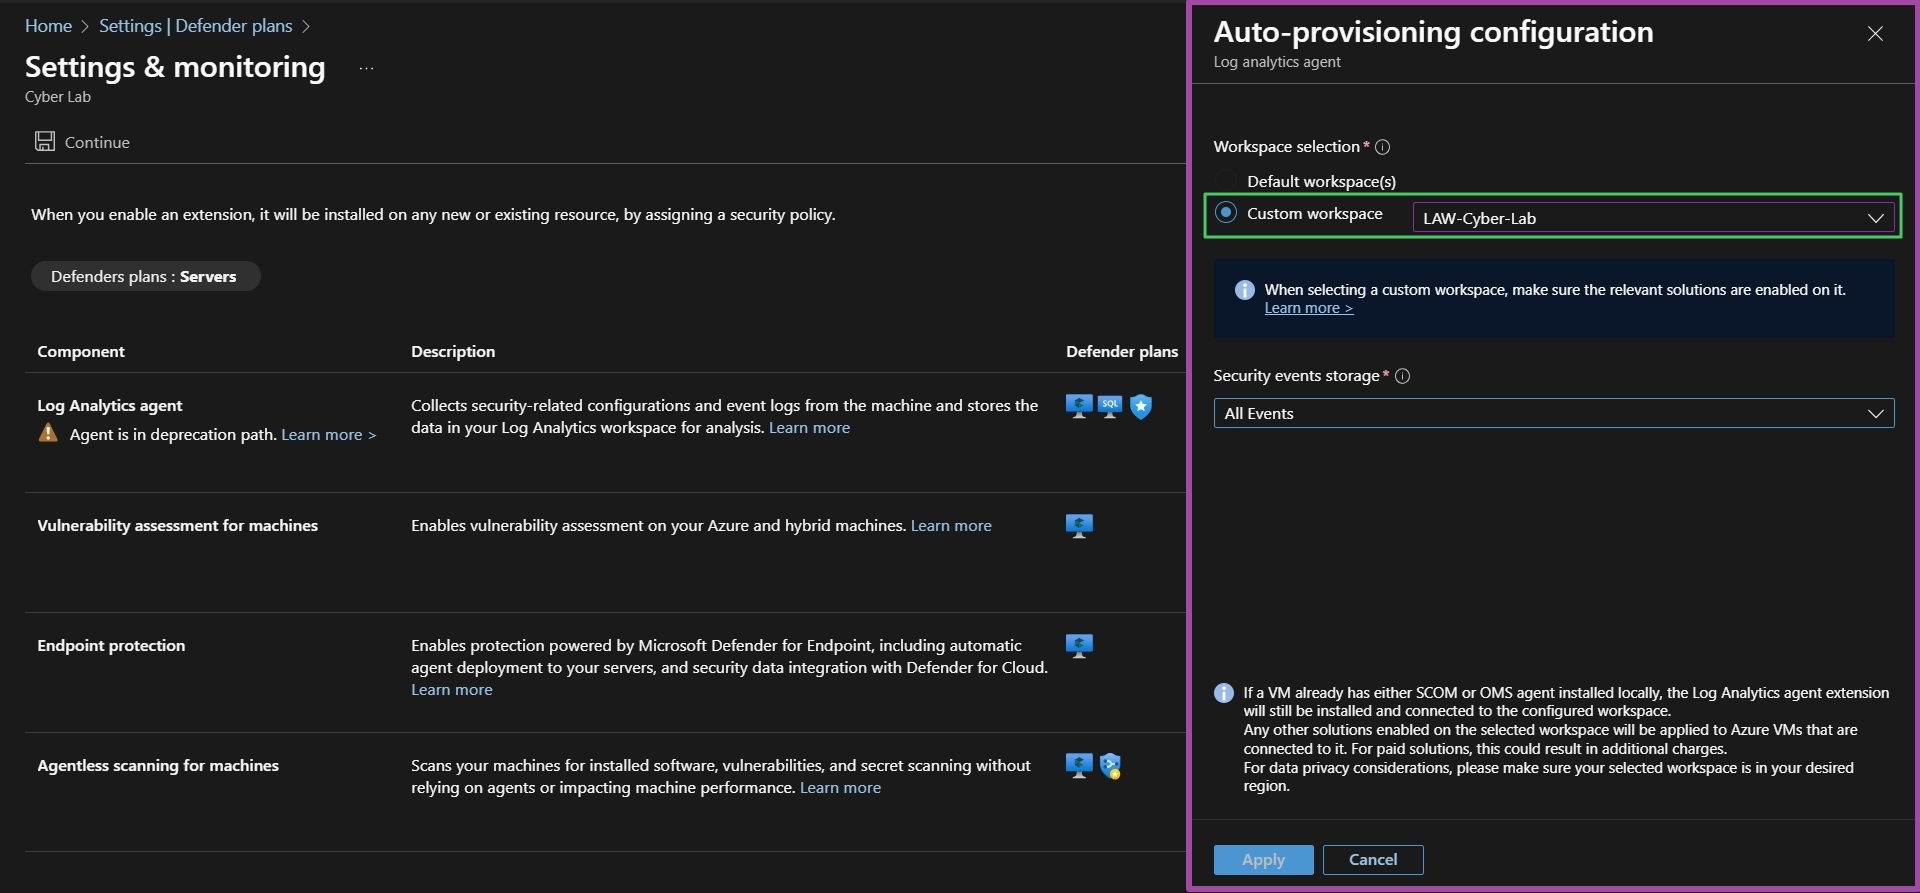
Note
If you accidentally saved before configuring the LAW agent: Go back and change to custom, then go through your resources and delete resources that were automatically provisioned in the processes. To avoid future mixups, make sure there is only ONE LAW.
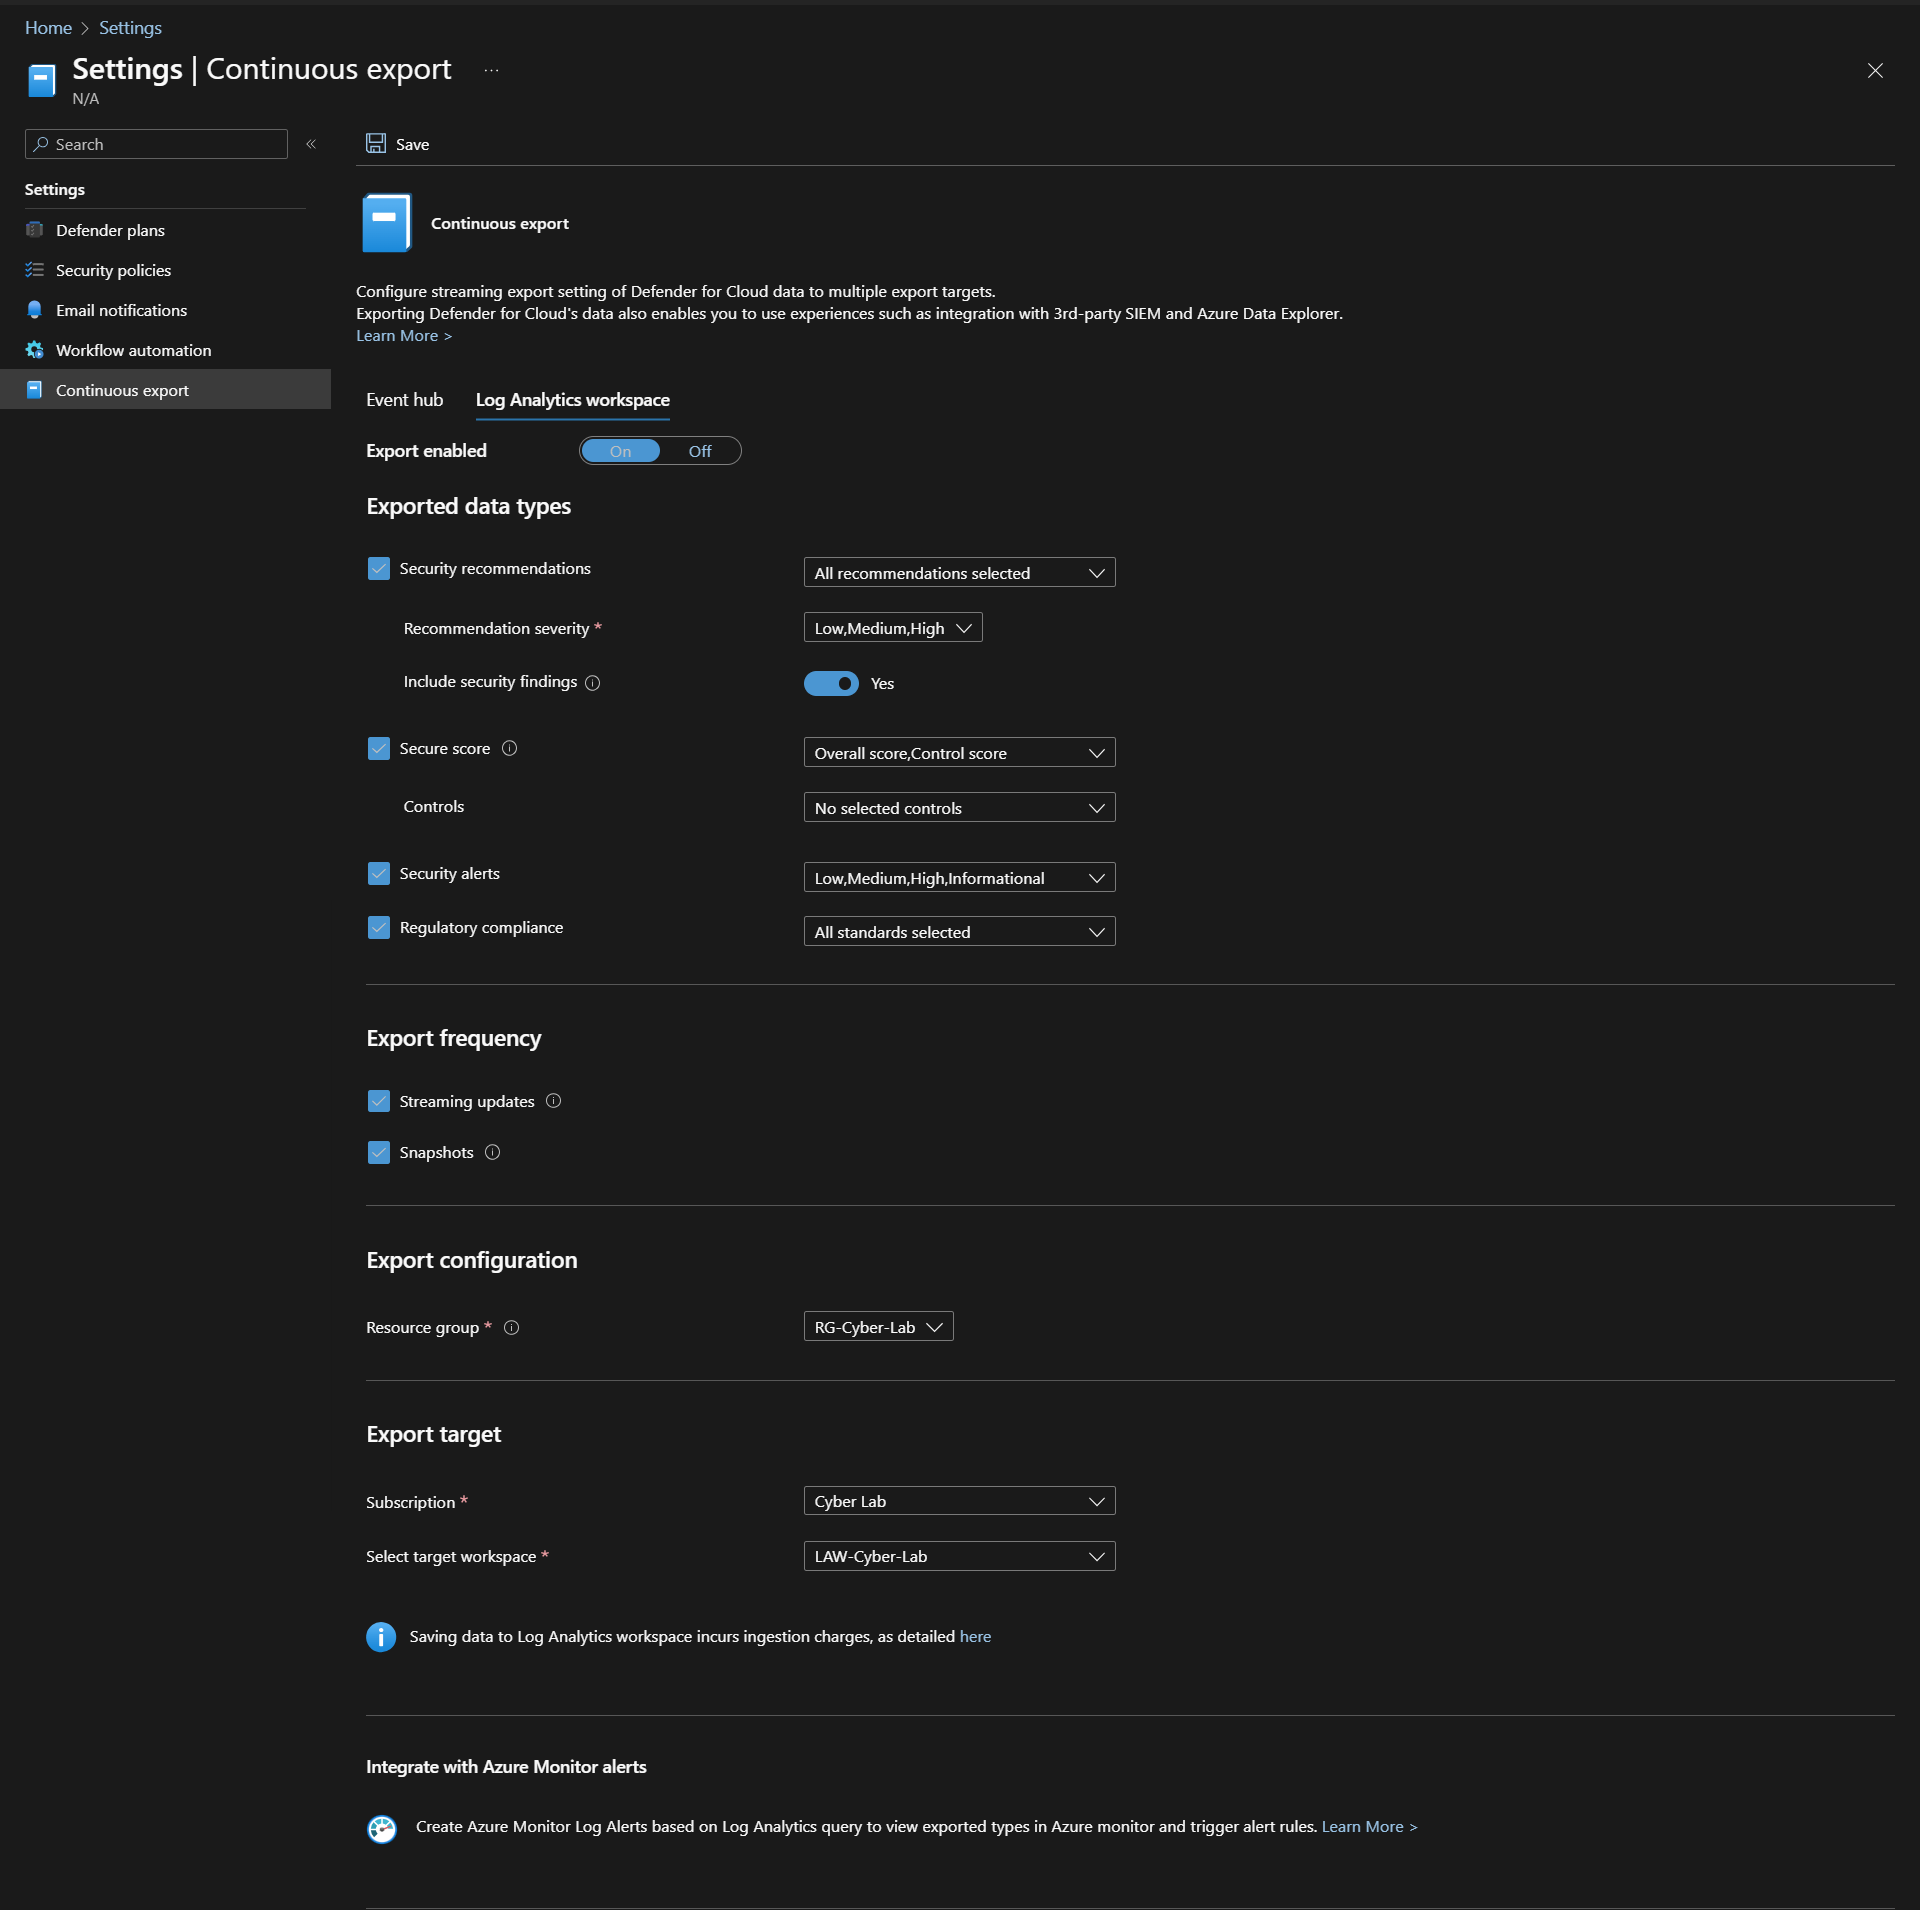
Click Continuous Export in the sidebar > Select Log Analytics Workspace at the top > toggle ON Select everything (will fine tune later).
Make sure export Export Configuration points to the resource group where the LAW is stored and Export target points to the appropriate subscription and LAW. Click Save.
Configure Log Collection for Virtual Machines
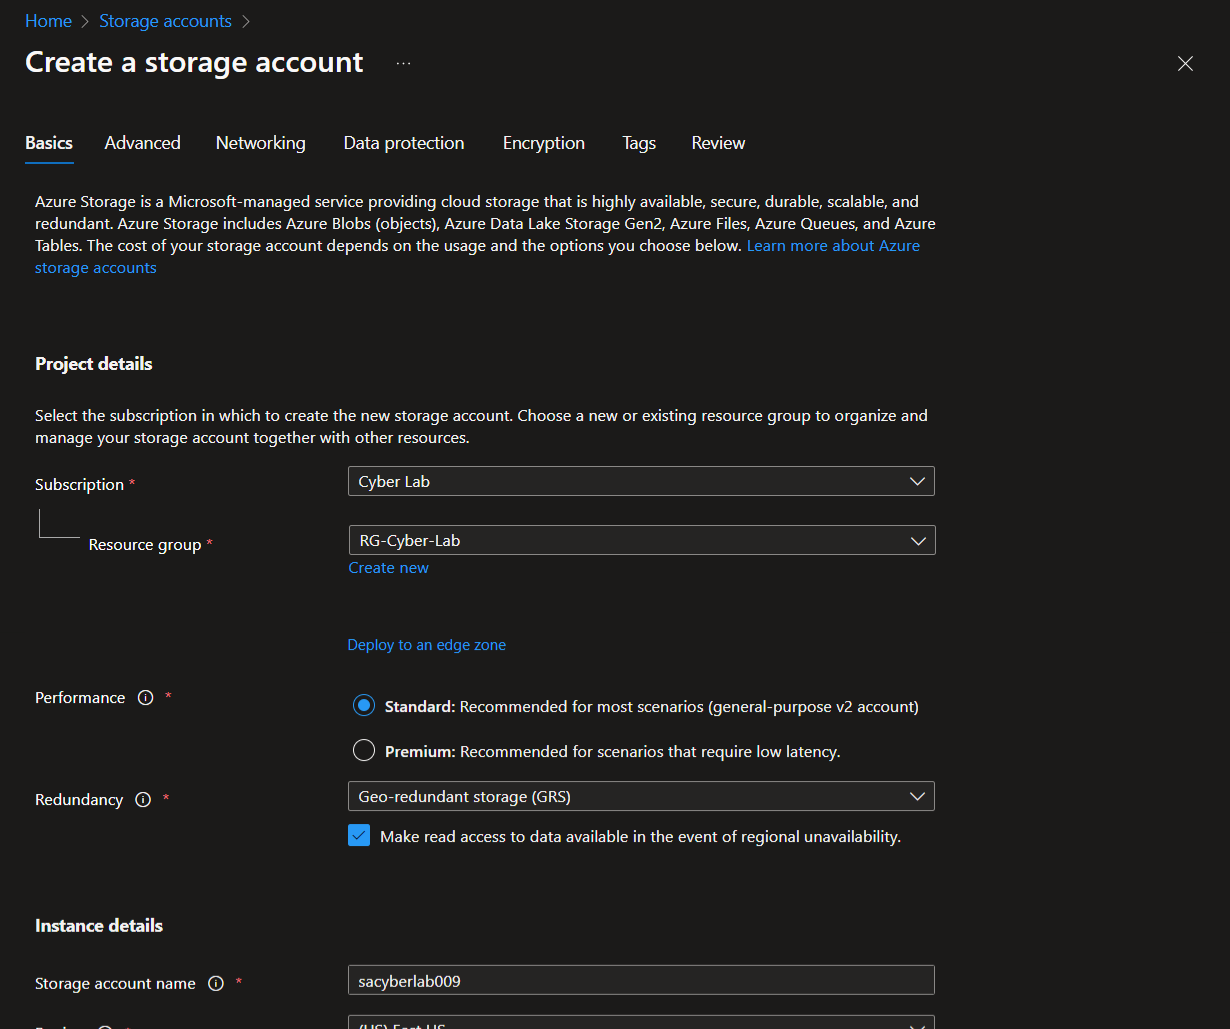
Create a Storage Account for Azure to place NSG flow logs later.
Note
Storage Account name must be globally unique.
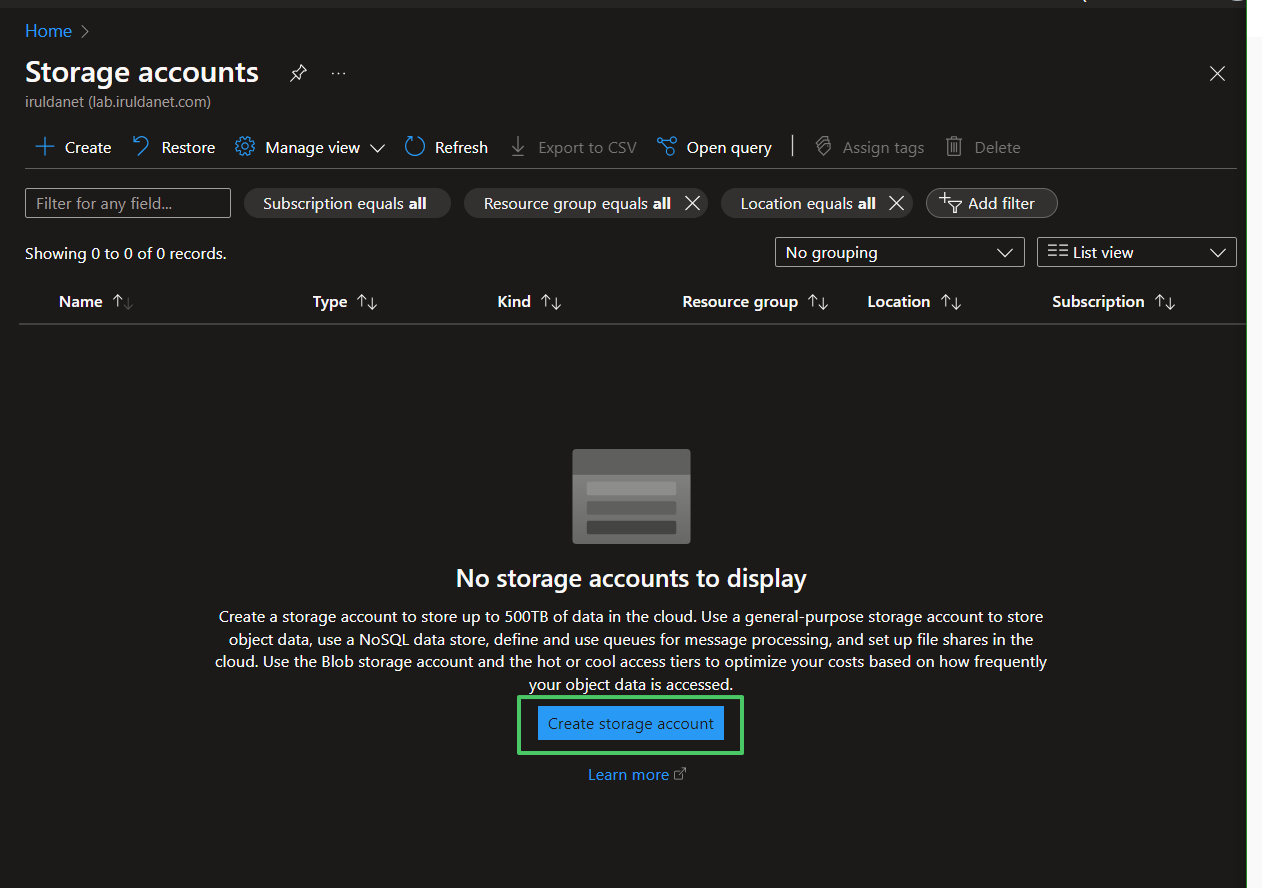
The important part is cut off here, but make sure the storage account is in the same region as the target VMs.
Enable NSG flow logs for target VMs
Go to Network Security Groups, pick one (any but preferably one attached to a target VM) > Under Monitoring, click NSG flow logs > Create flow log
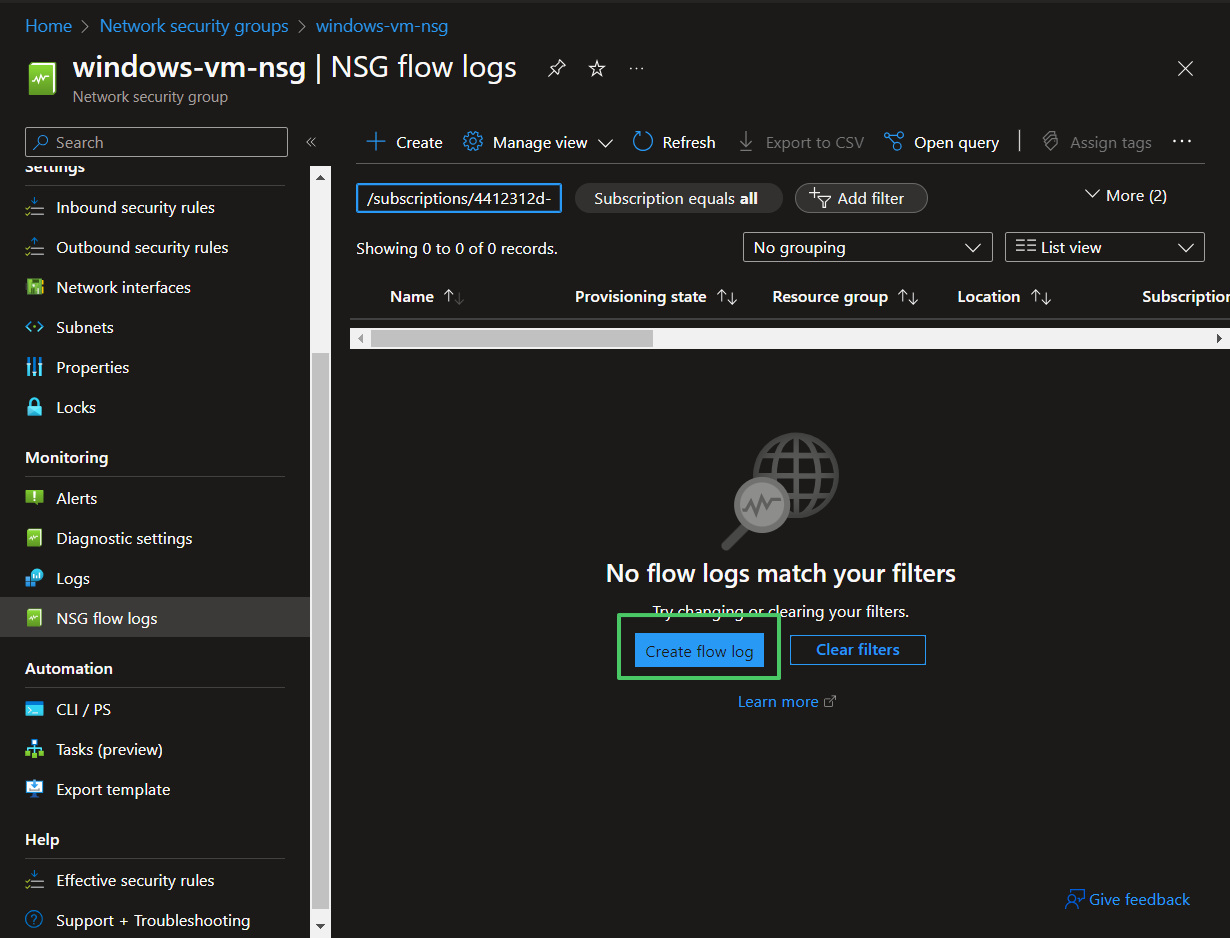
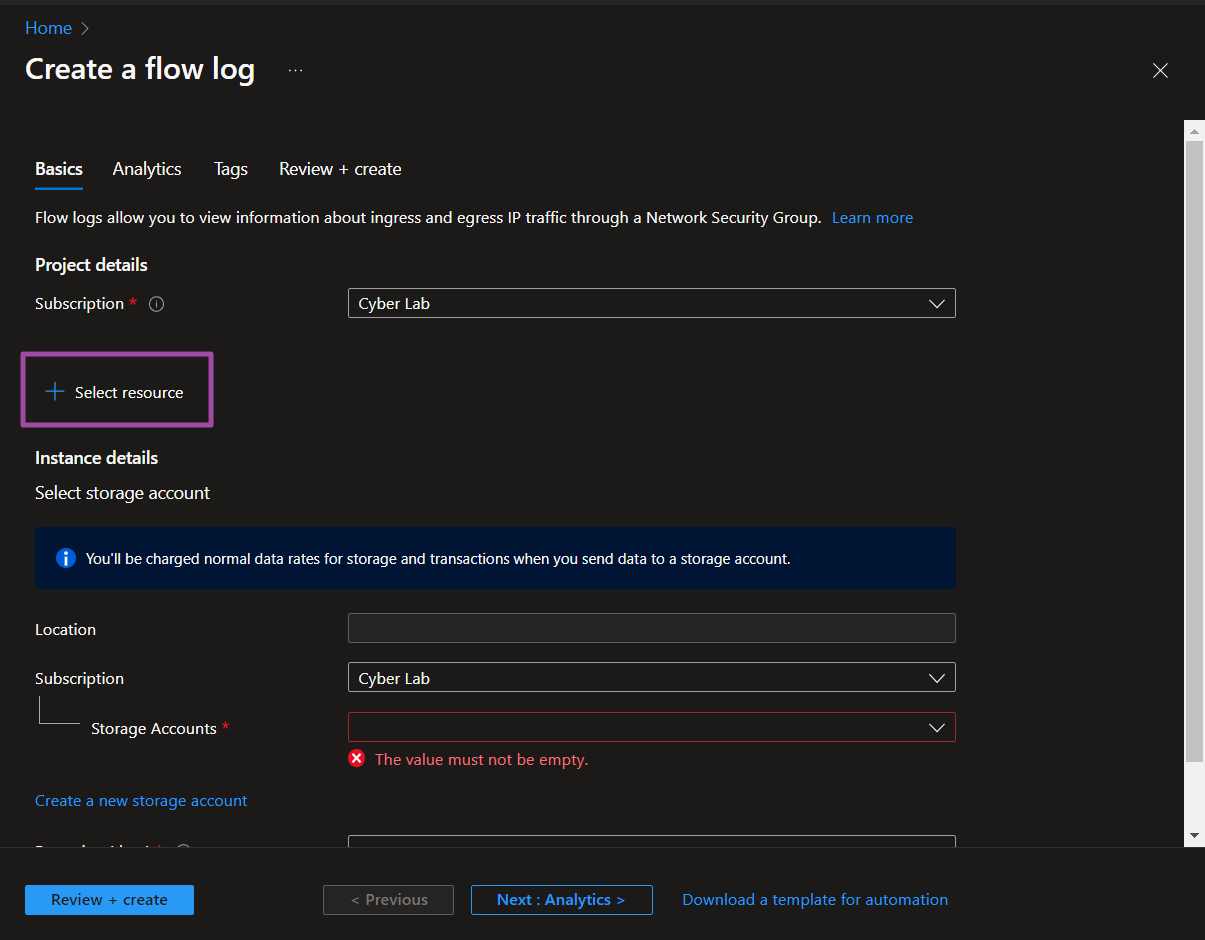
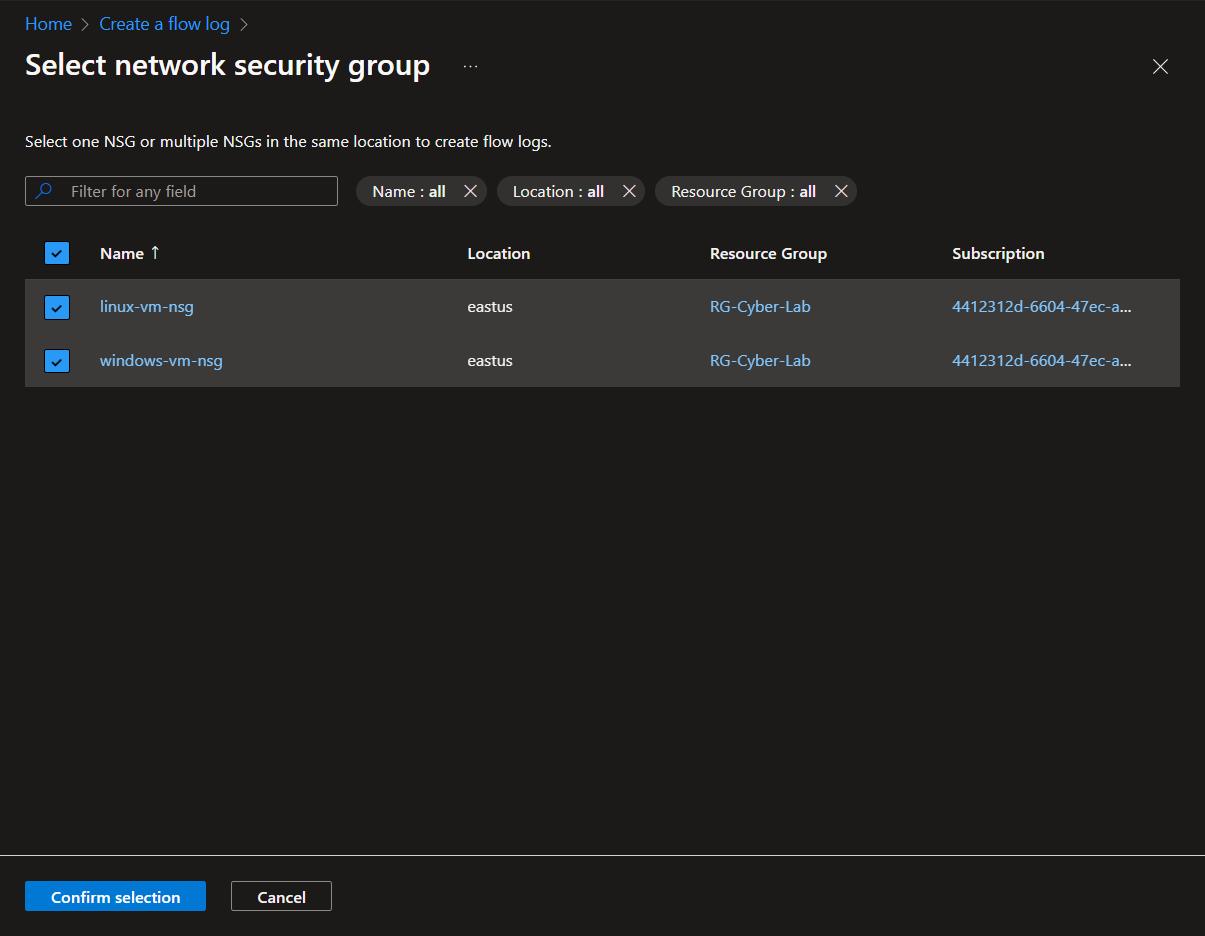
Click +Resource > Select the target VM's > Confirm Selection
Create a Data Collection Rule for target VMs
First make sure target VMs are running. The Microsoft Defender or will automatically install the agent to the VMs once they are running, if not, you can manually install later.
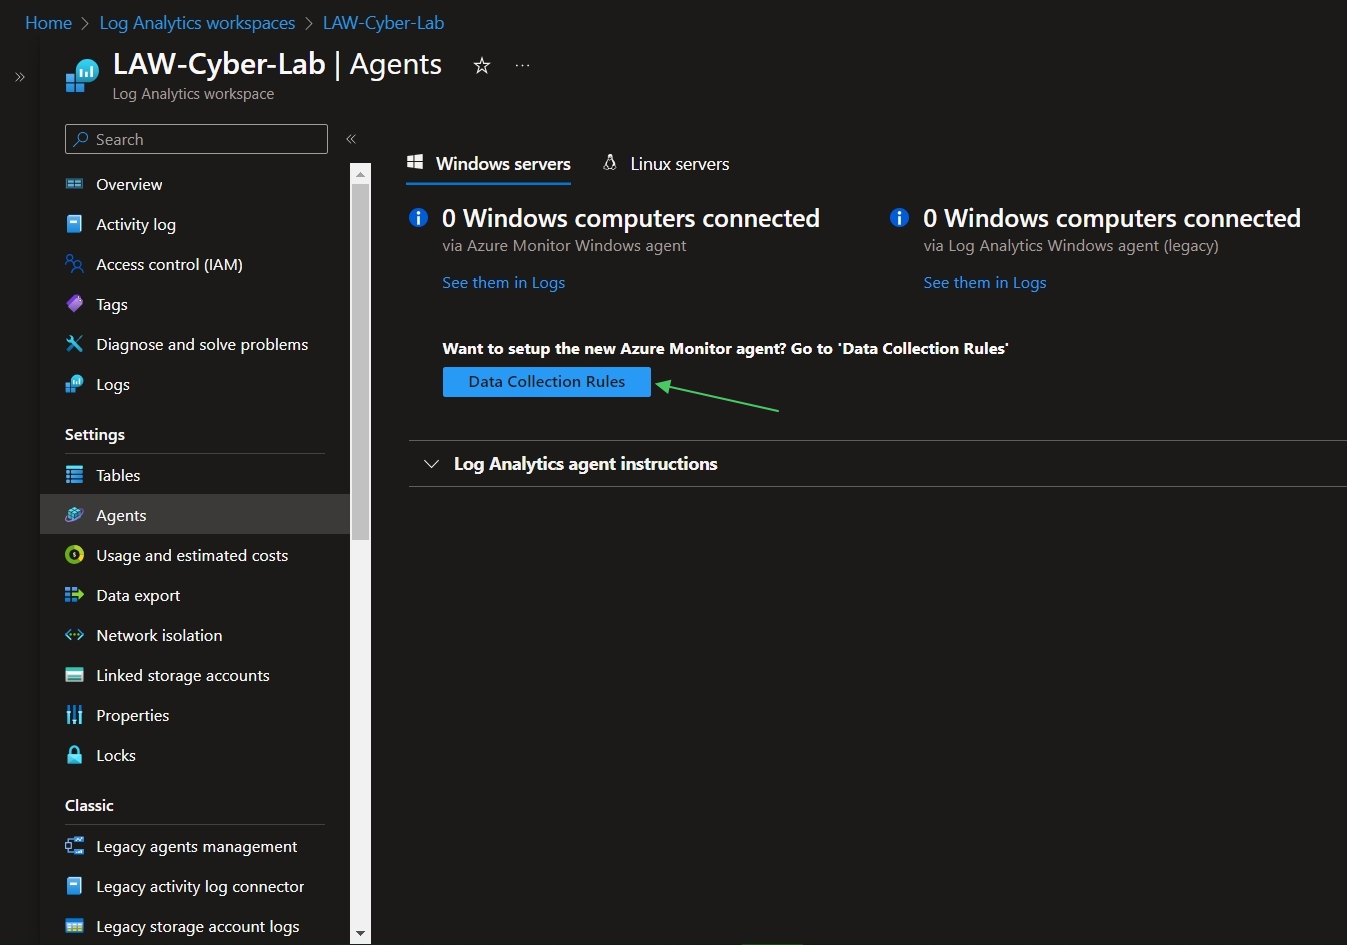
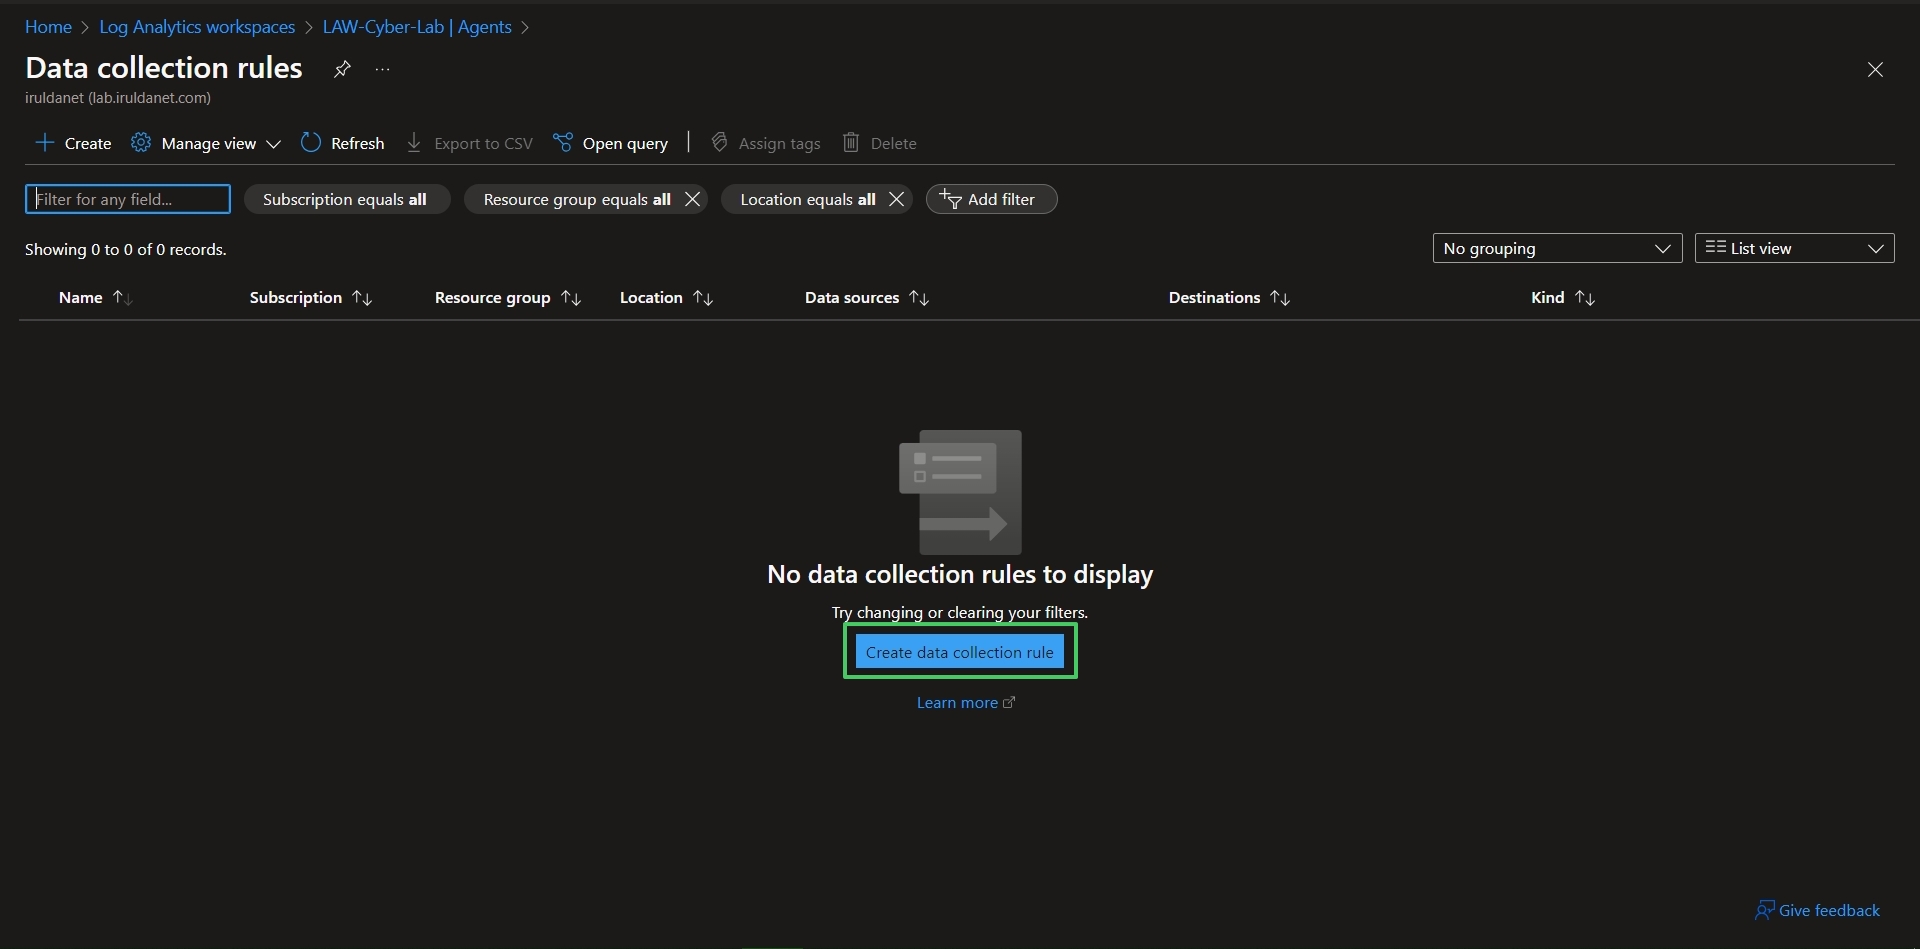
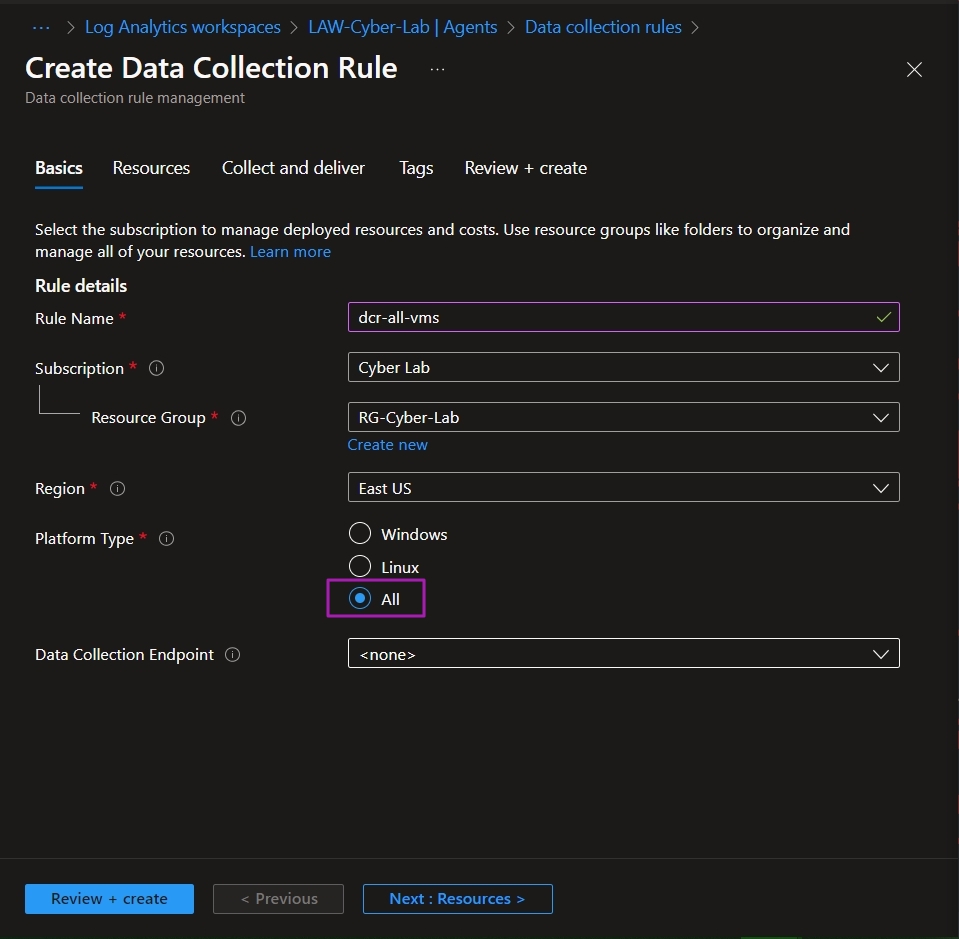
Next, go to LAW > Agents > Data Collection Rules > Create Data Collection Rule
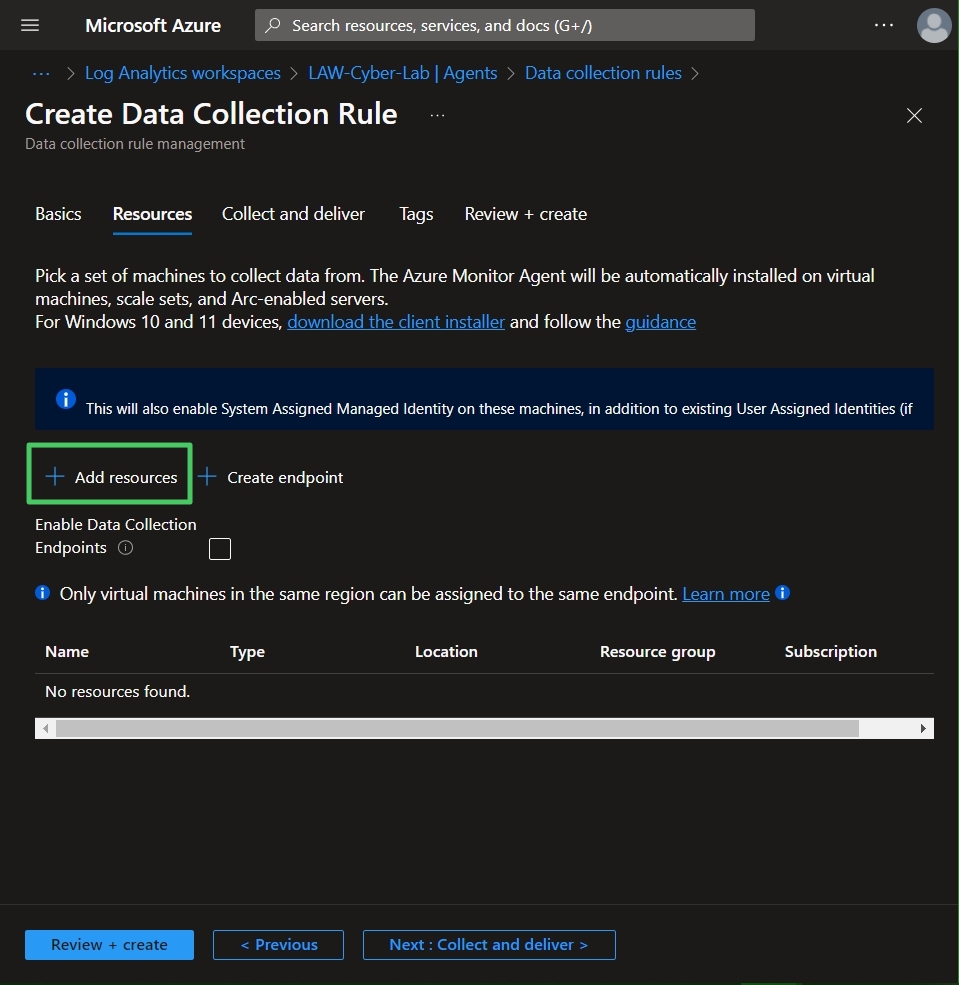
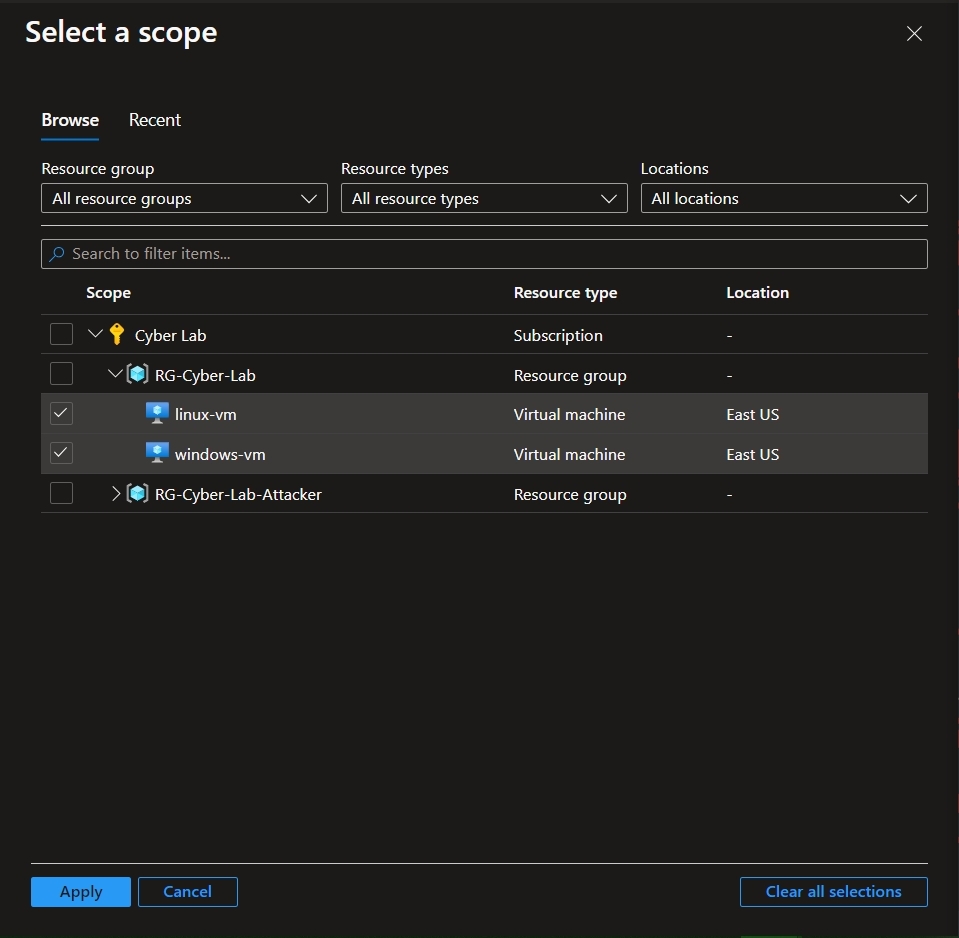
Click + Add Resources, and select target VMs > Apply.
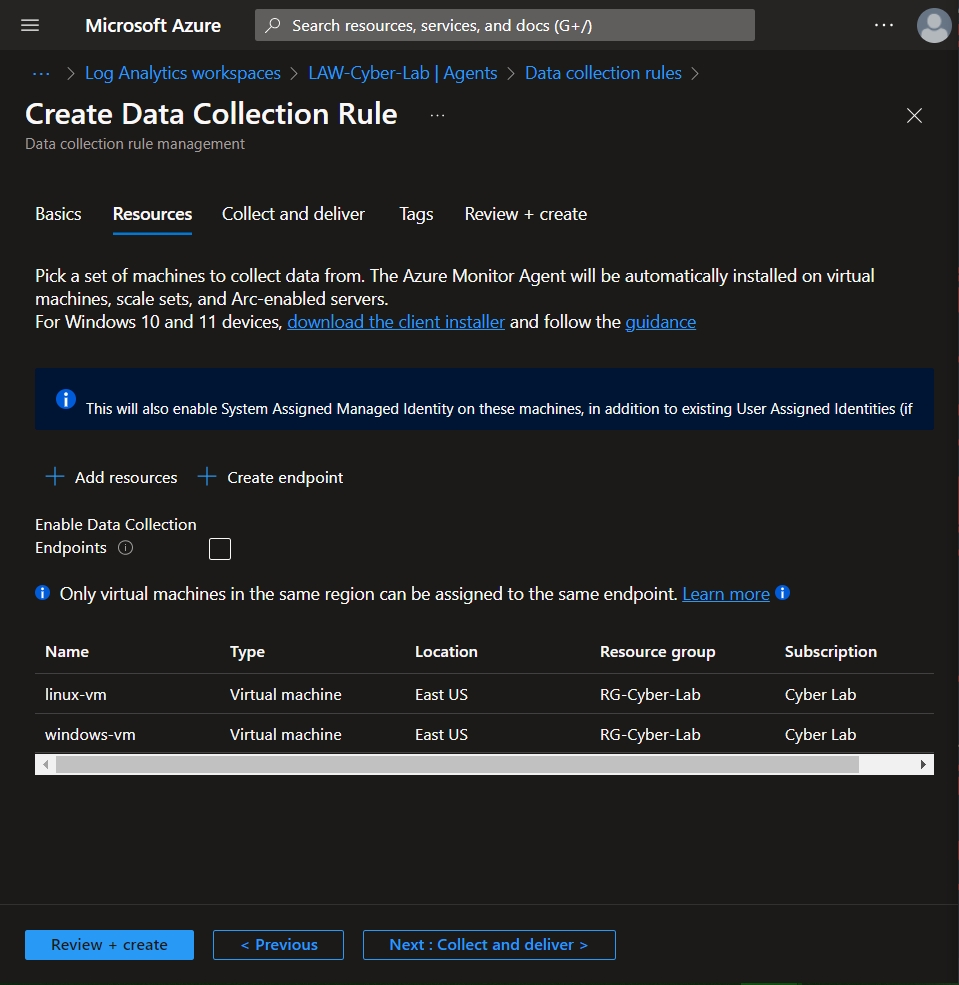
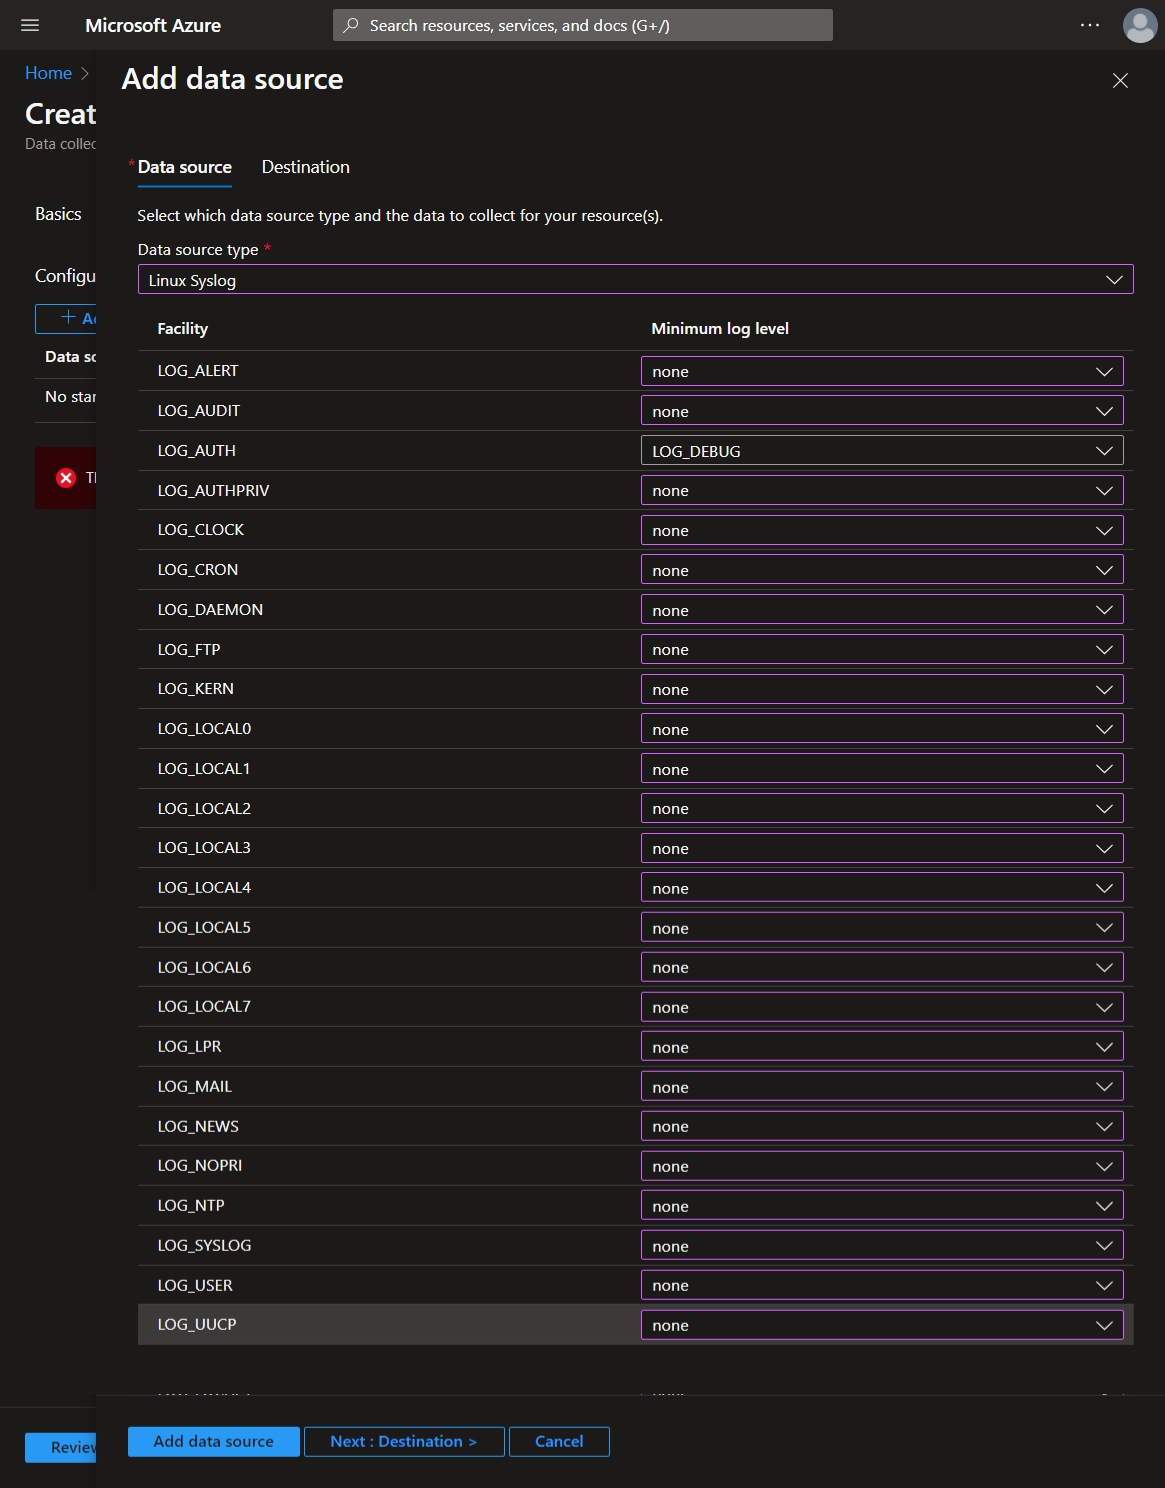
Click 'Next: Collect and deliver >' + Data Source and add select Linux Syslog from the dropdown for Data Source Type. Then only collect logs for LOG_AUTH (set all other logs to 'none' value) > Next: Destination
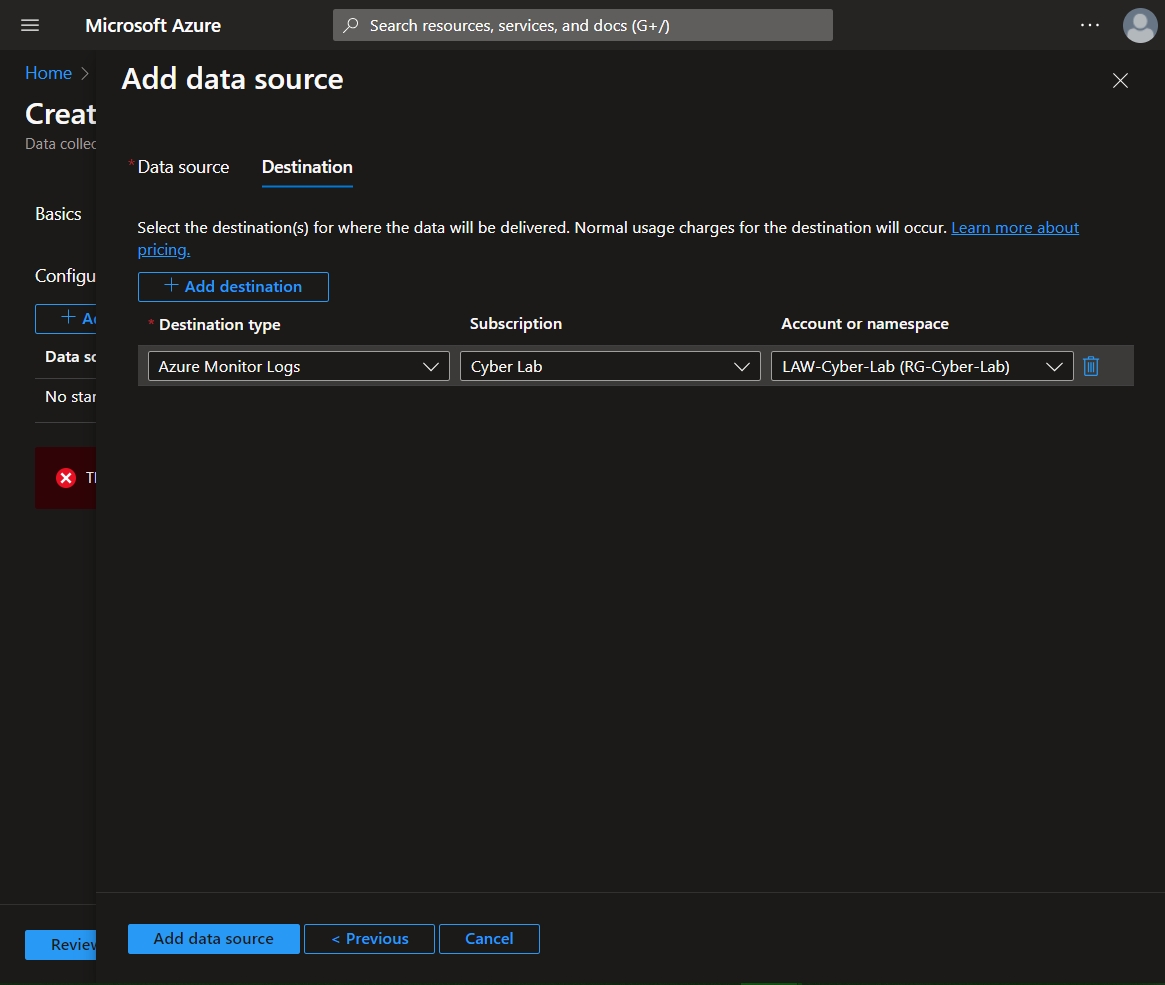
Set the destination to the Log Analytics Workspace > Add data source
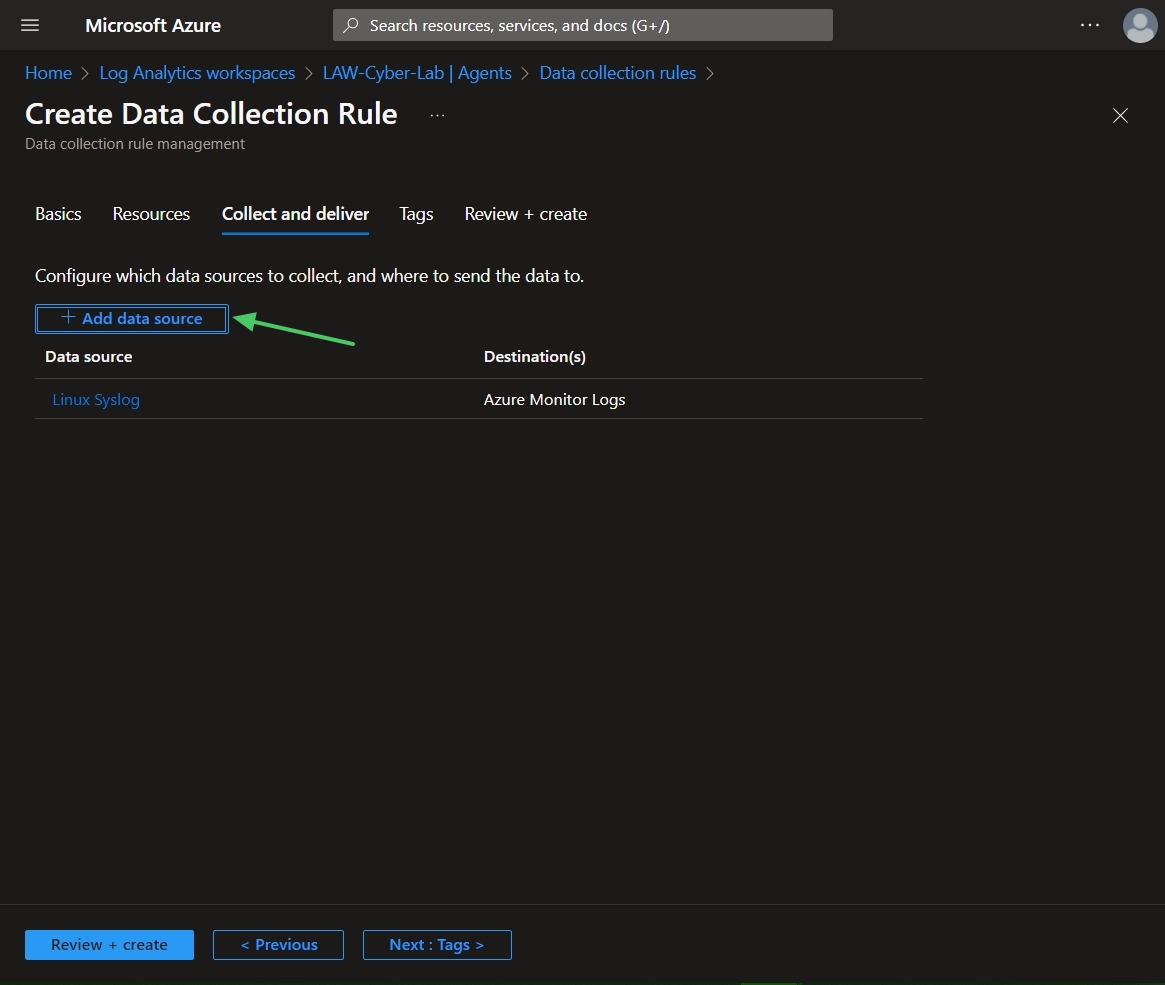
Add another data source, this time for Windows logs.
Select Windows Event Logs from the data source dropdown. Under Basic > Application, Select Information. Under Security, select both Audit success and Audit failure to pull in failed authentication logs from RDP and the SQL Server.
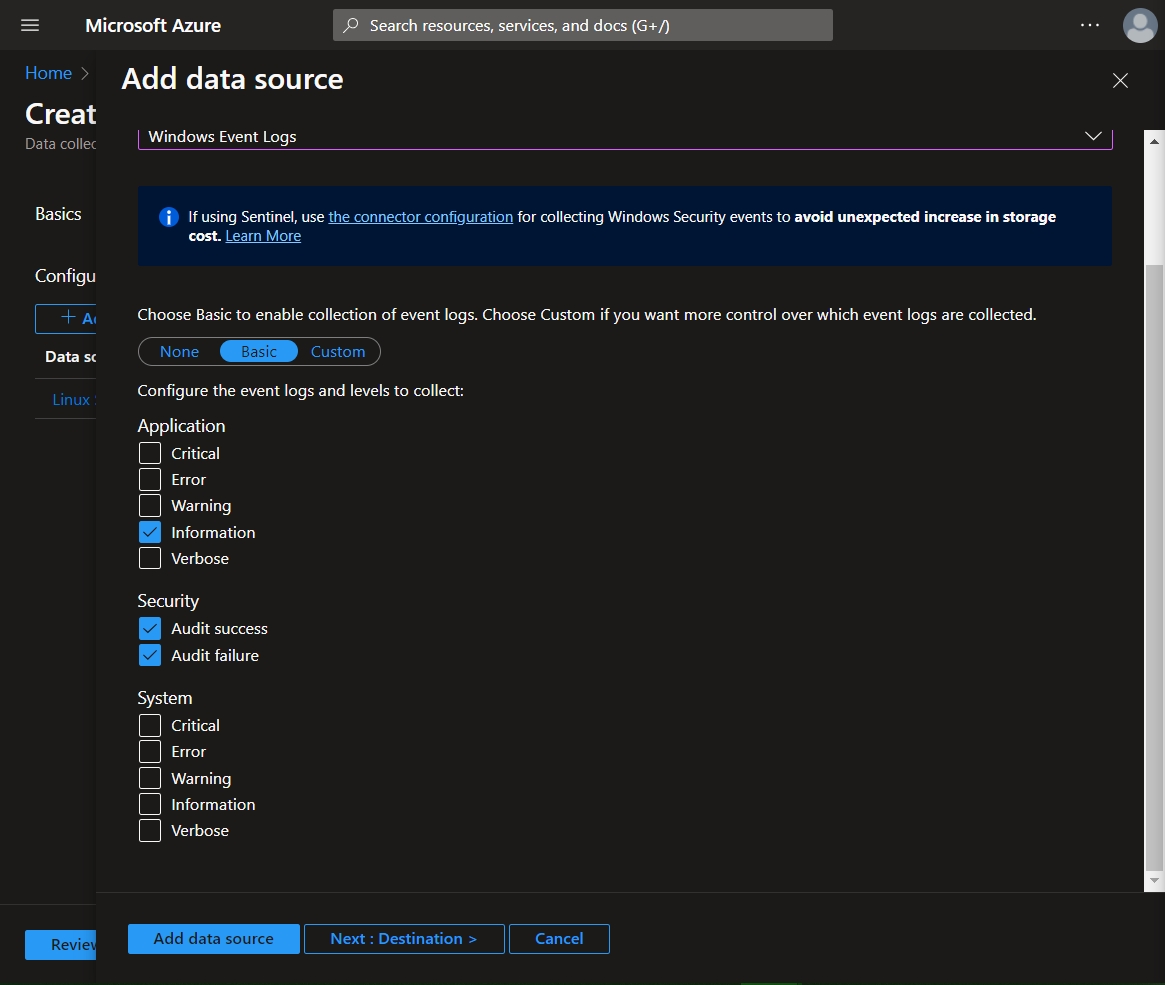
As you can see the options here are pretty, well, basic. In order to retrieve (filter) specific data from Windows event logs, XPath queries must be used. Switch over to Custom and add the following X-Path Queries:
For Windows Defender Malware Detection:
Microsoft-Windows-Windows Defender/Operational!*[System[(EventID=1116 or EventID=1117)]]
For Windows Firewall Tampering Detection:
Microsoft-Windows-Windows Firewall With Advanced Security/Firewall!*[System[(EventID=2003)]]
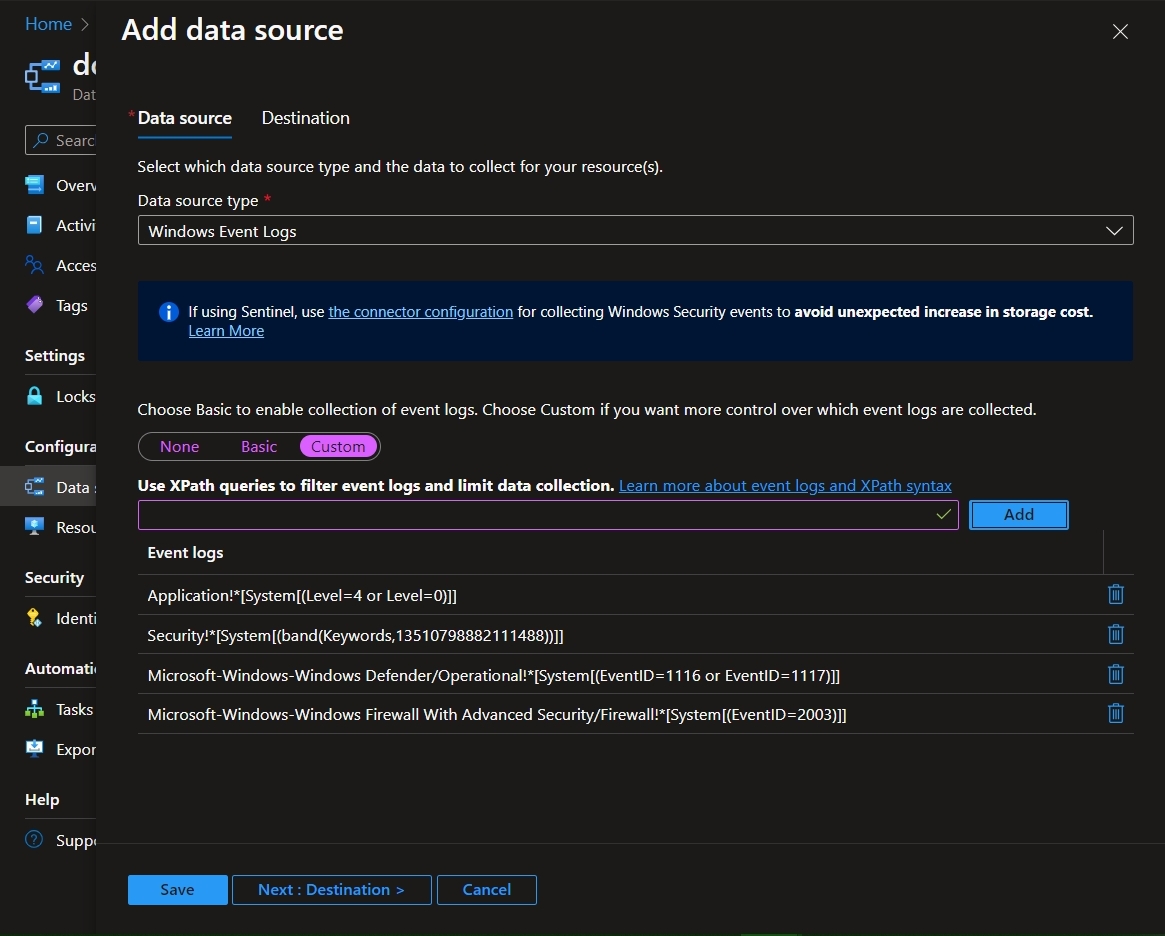
Save > Next: Destination and check that the logs are going to the appropriate LAW > Add data source > Review + Create > Create
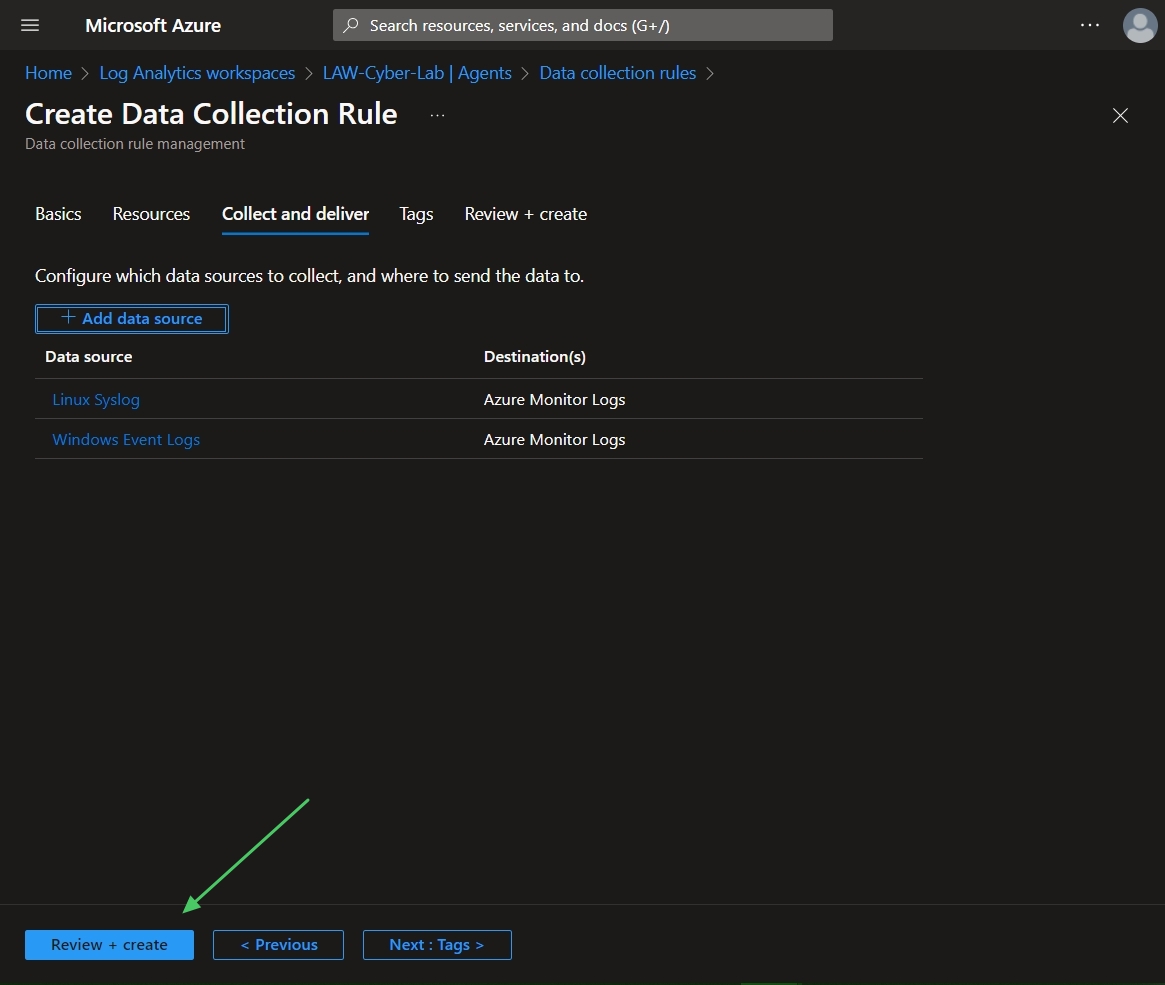
Data Collection Rule complete and deployed
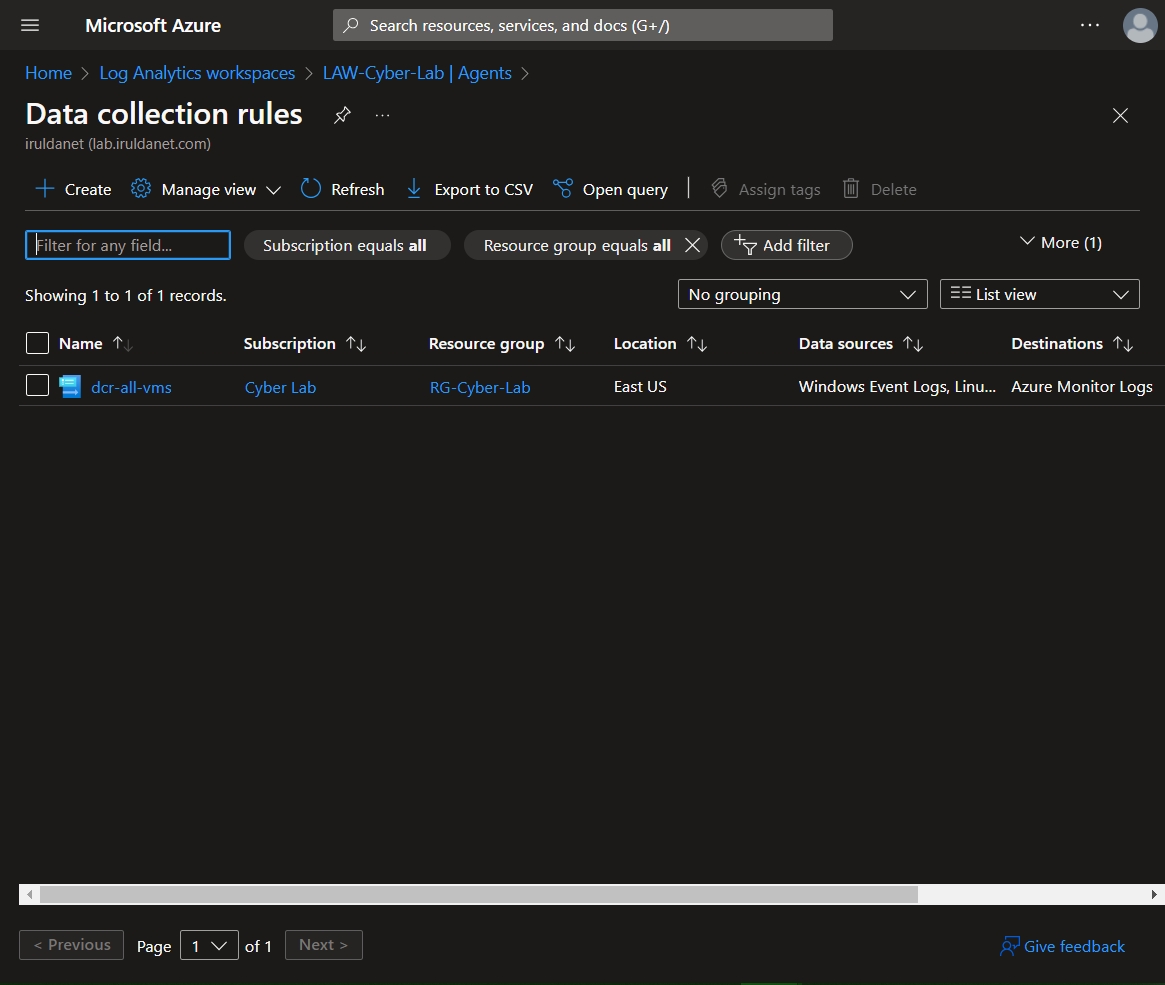
If you check back to LAW > Agents, the agents should have deployed and installed on the target VMs
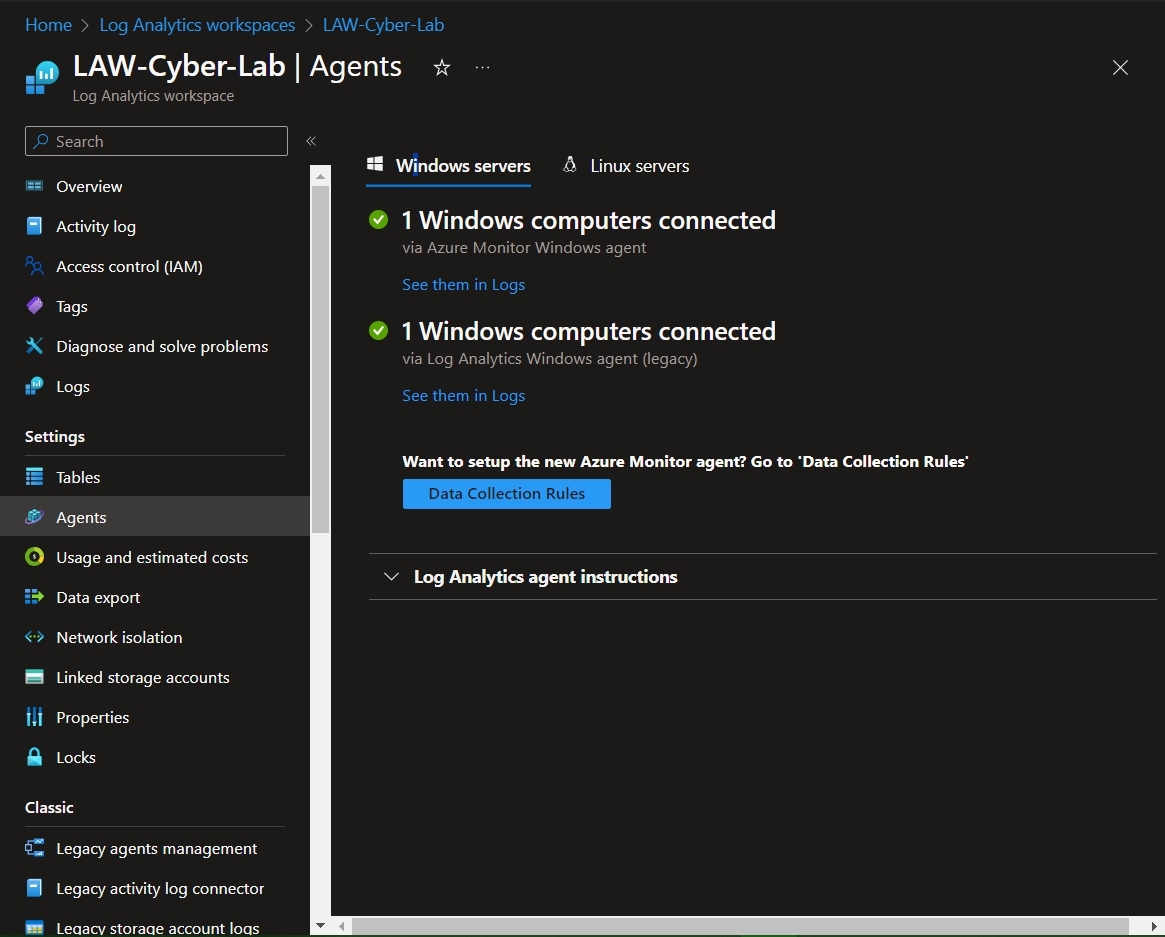
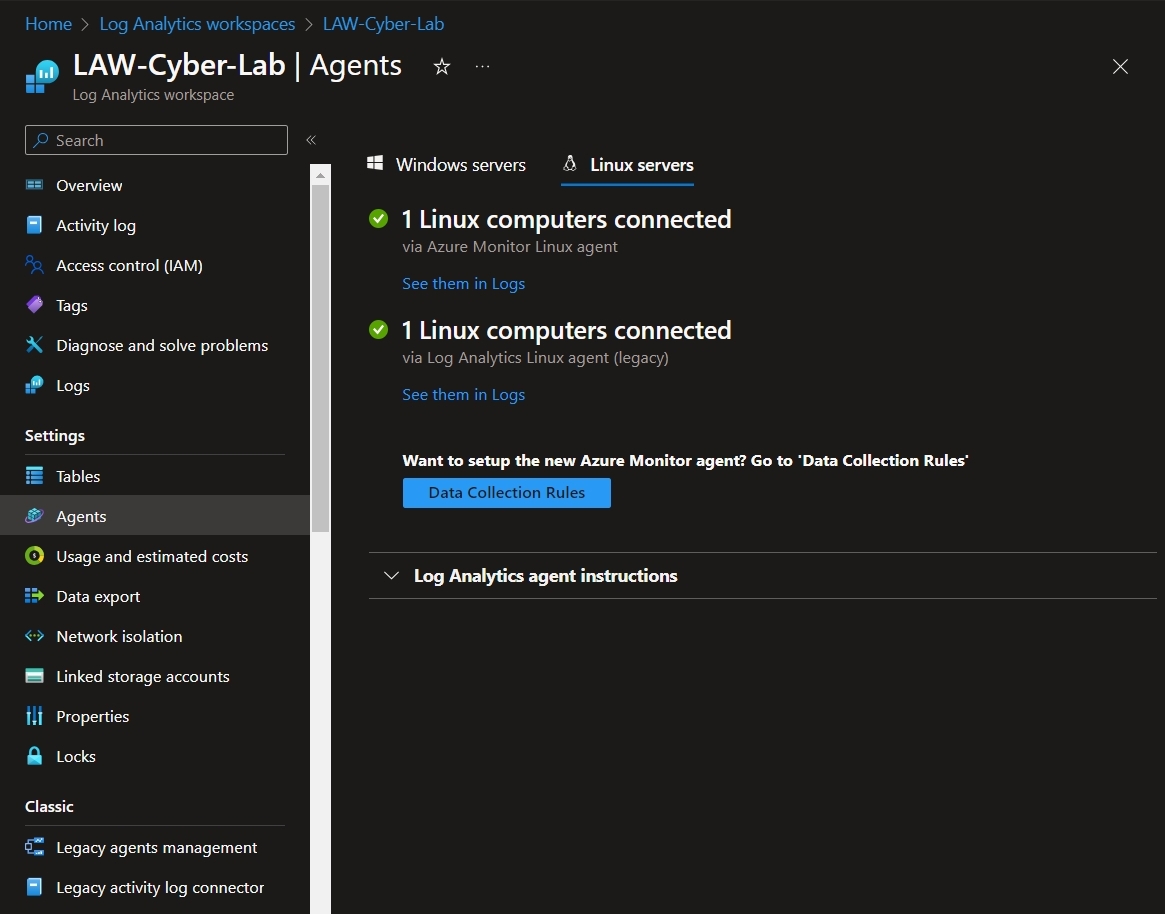
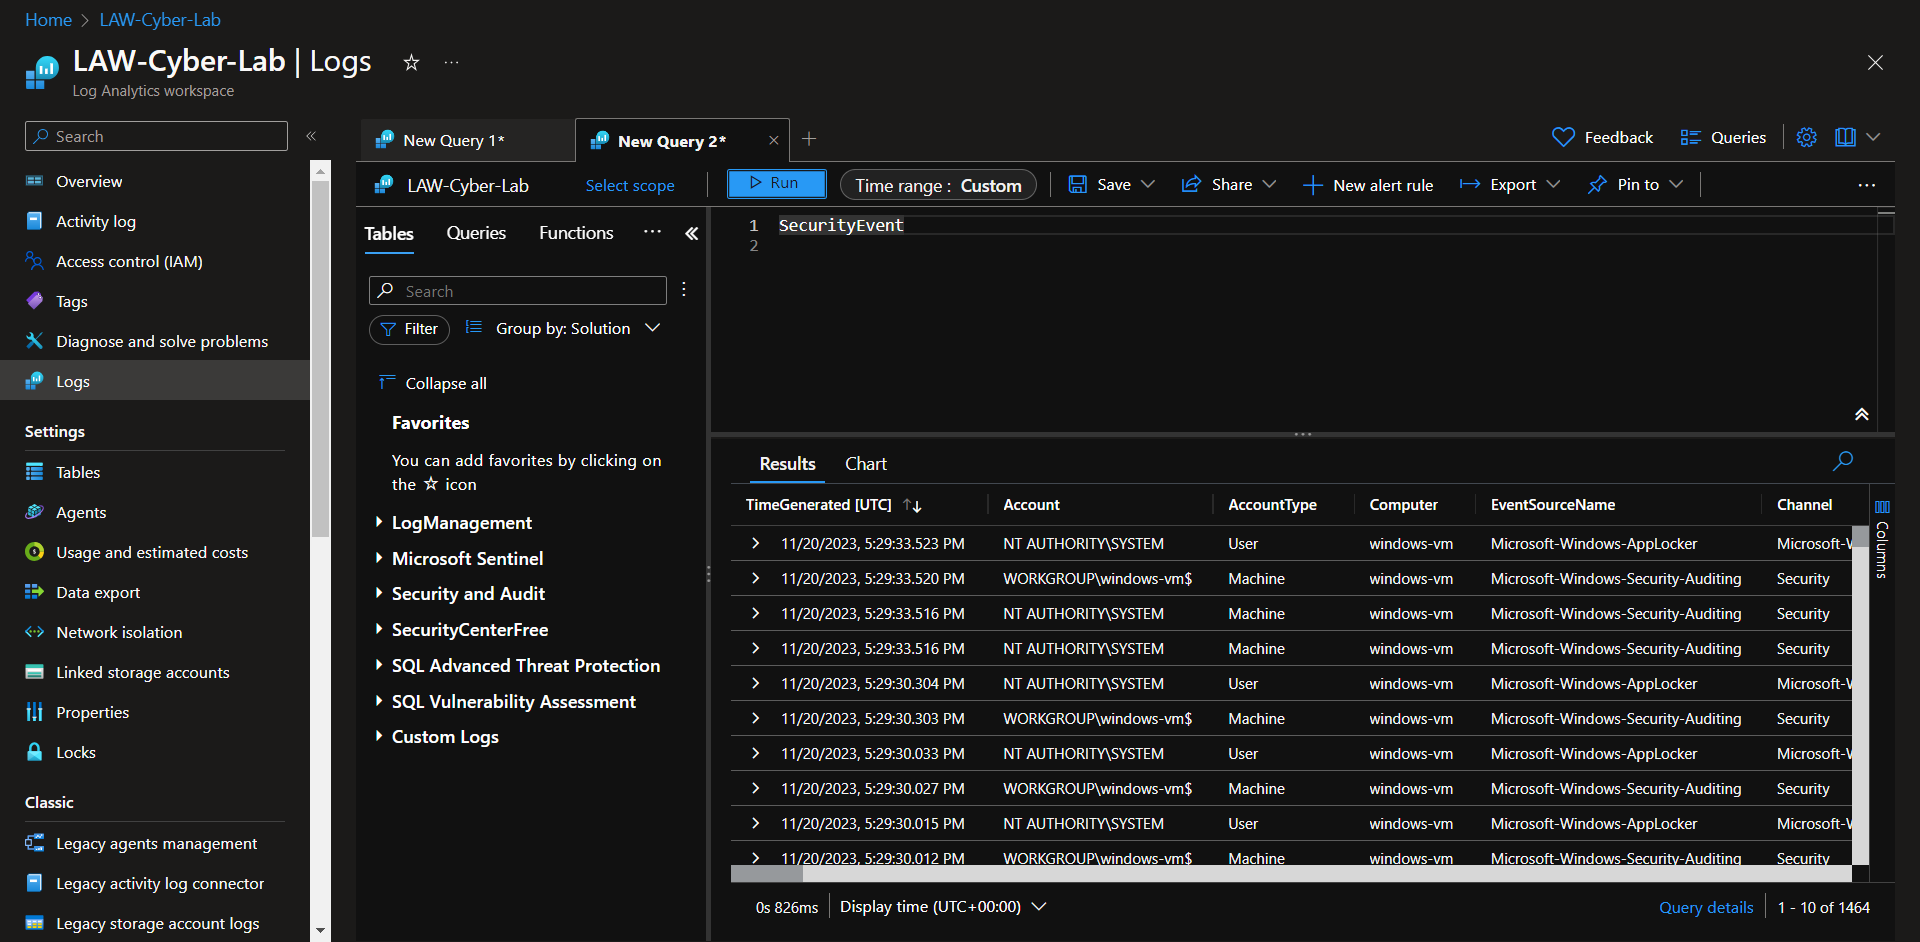
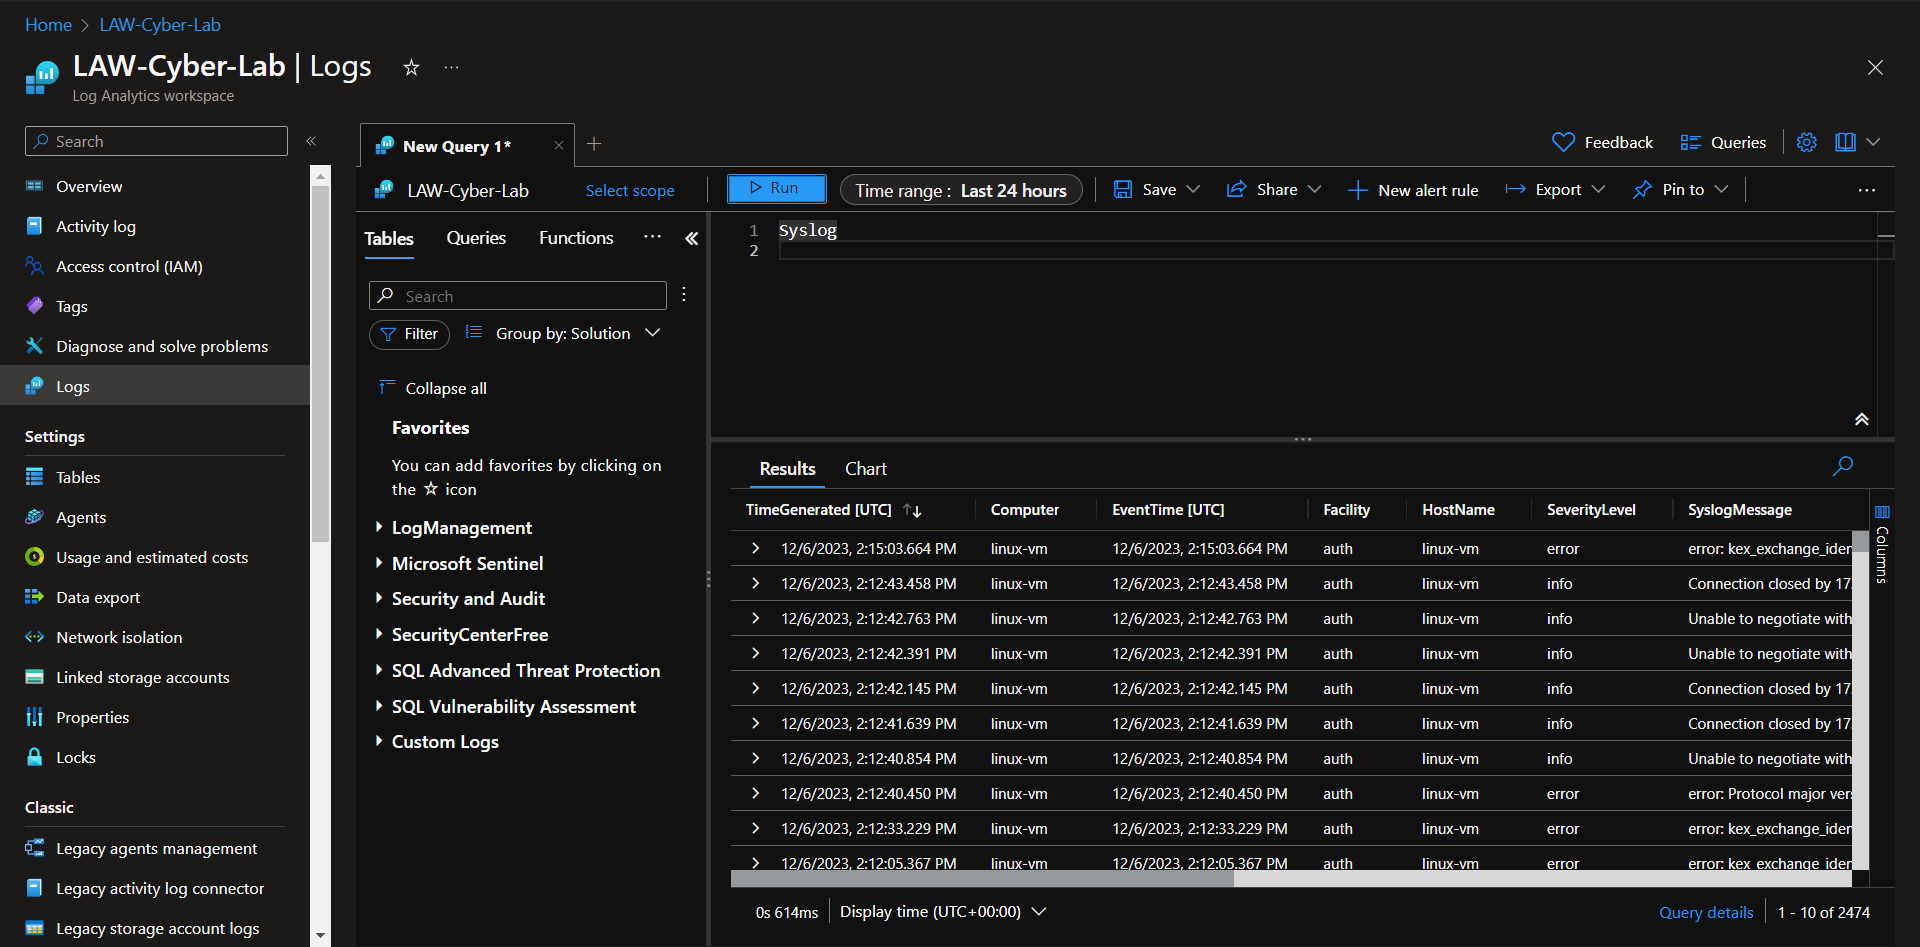
Ideally, at this point you would start querying Log Analytics for logs from the VMs and NSGs to make sure the logs are coming in:
- Syslog (linux)
- SecurityEvent (windows)
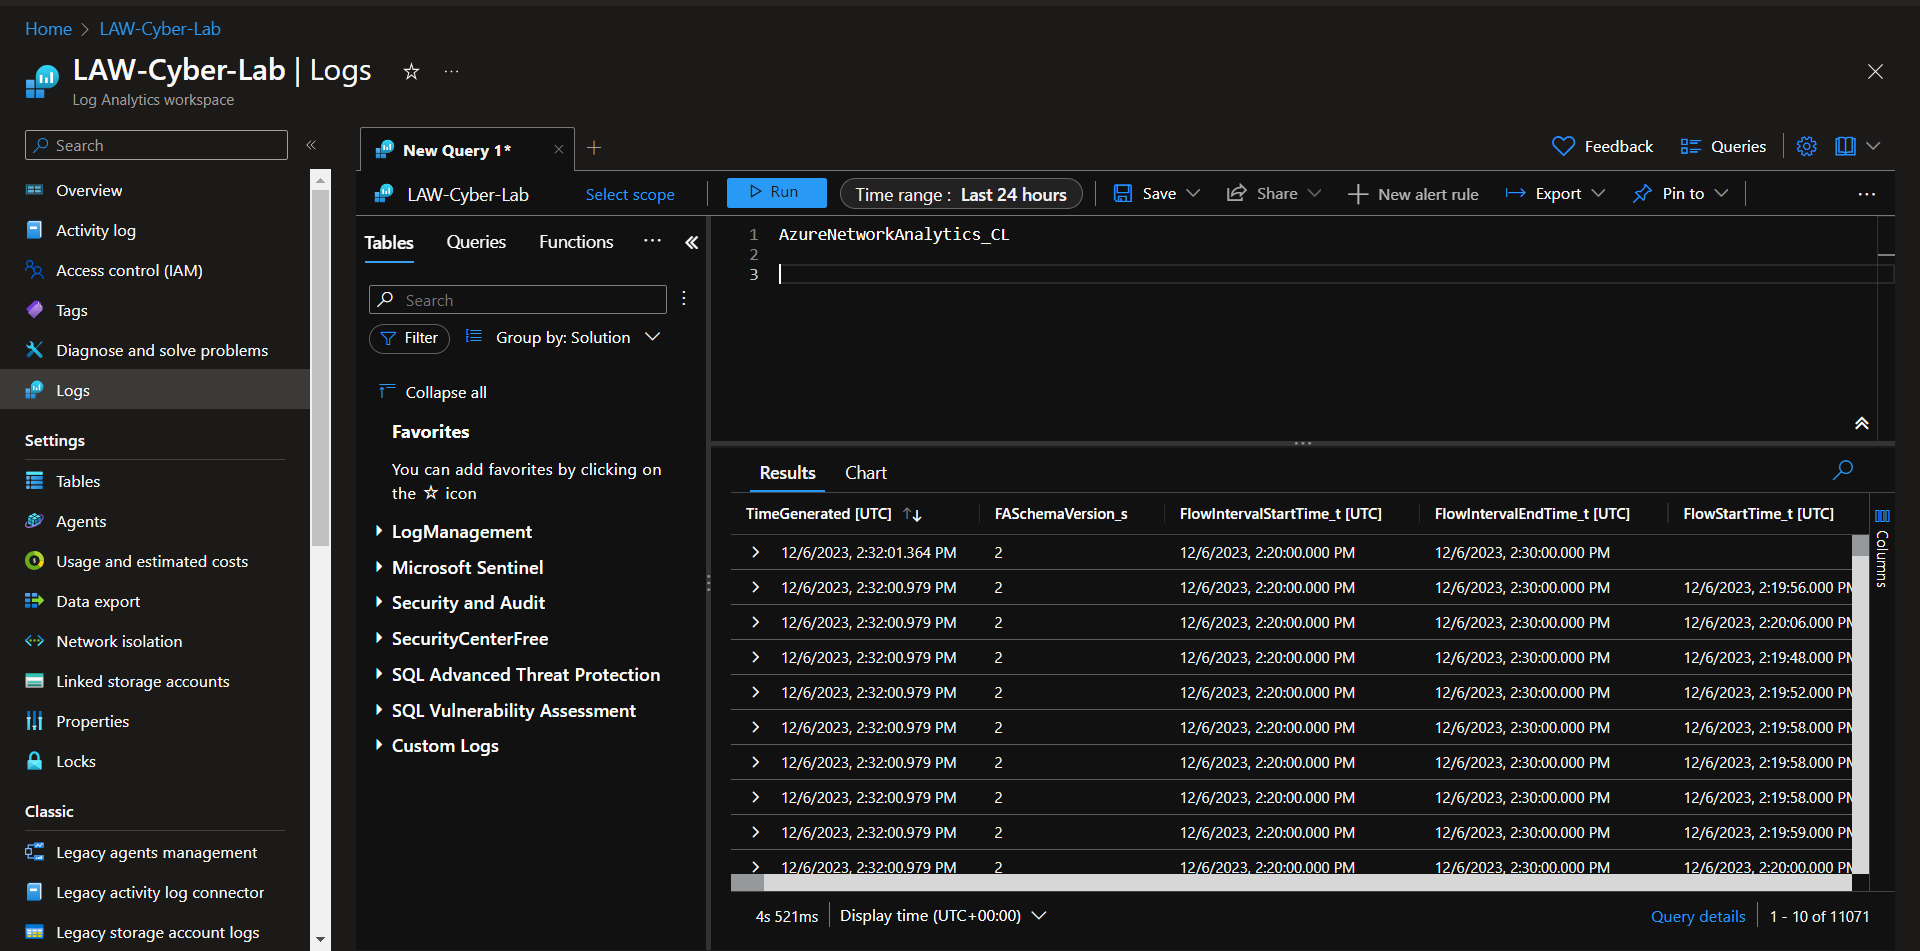
- AzureNetworkAnalytics_CL (Network Security Groups/NSGs)
SecurityEvent:
Syslog:
AzureNetworkAnalytics_CL:
Tenant Level Logging
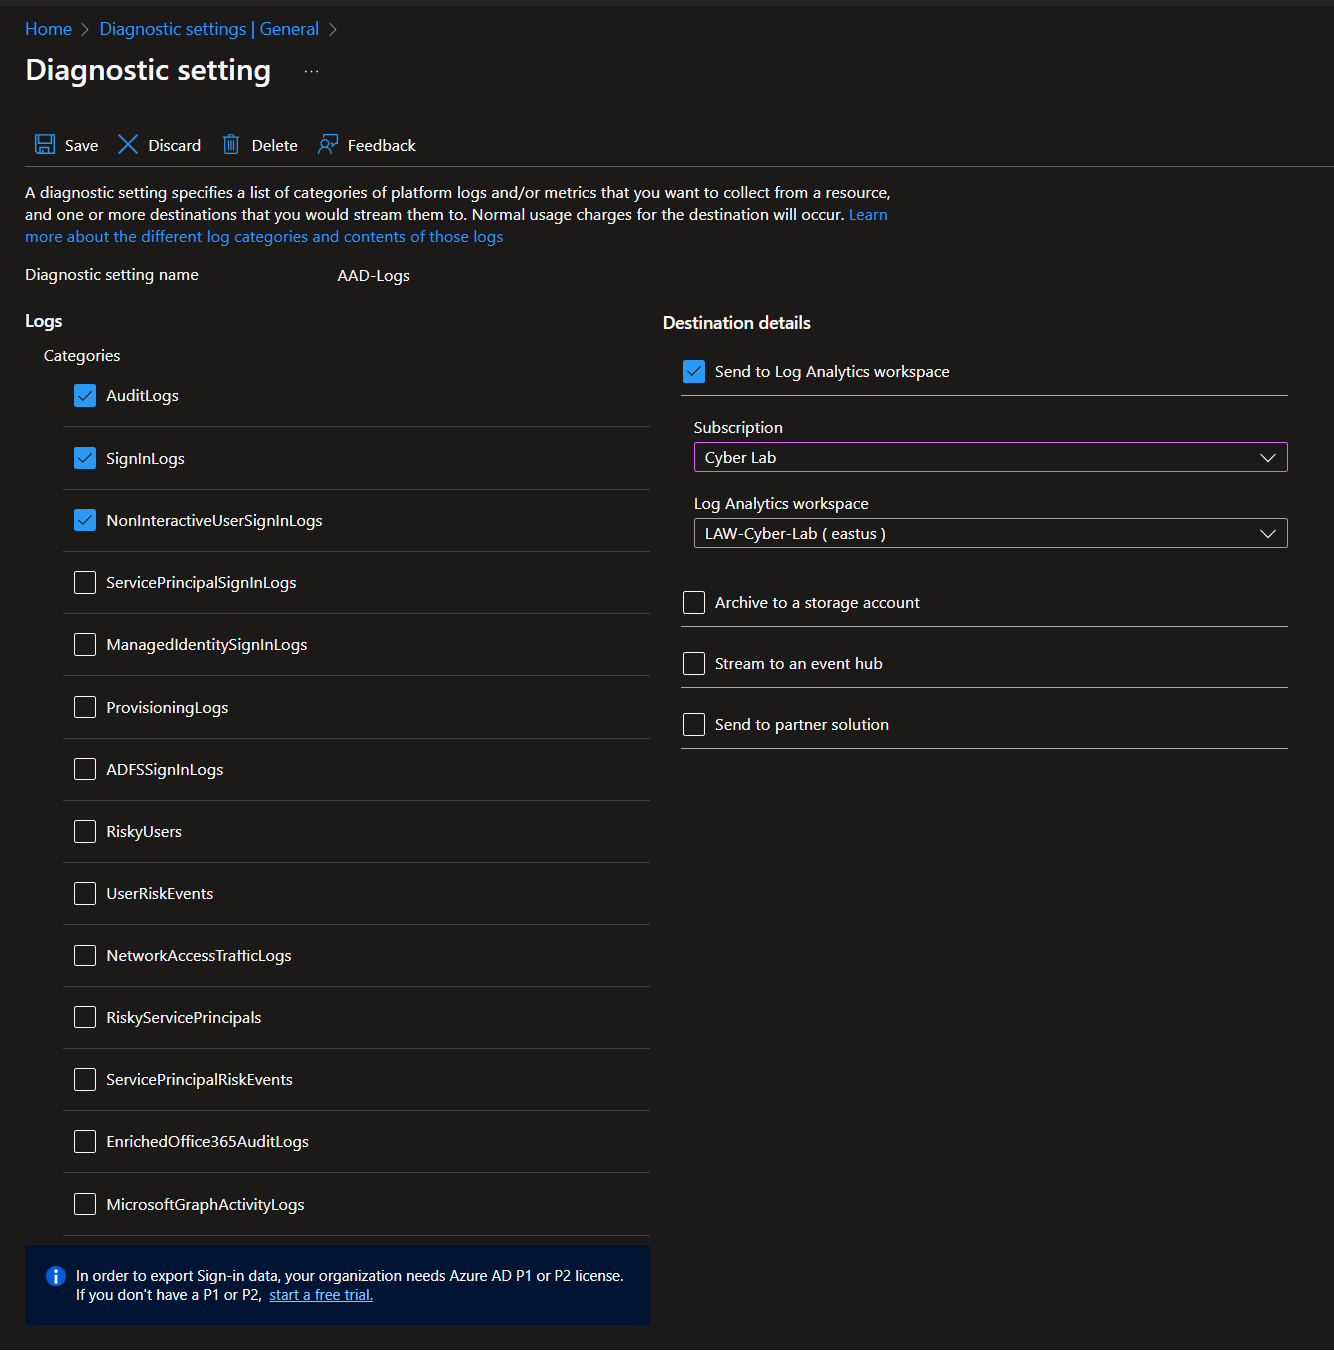
Create diagnostic settings in Azure Active Directory (Microsoft Entra ID) that allows us to ingest logs.
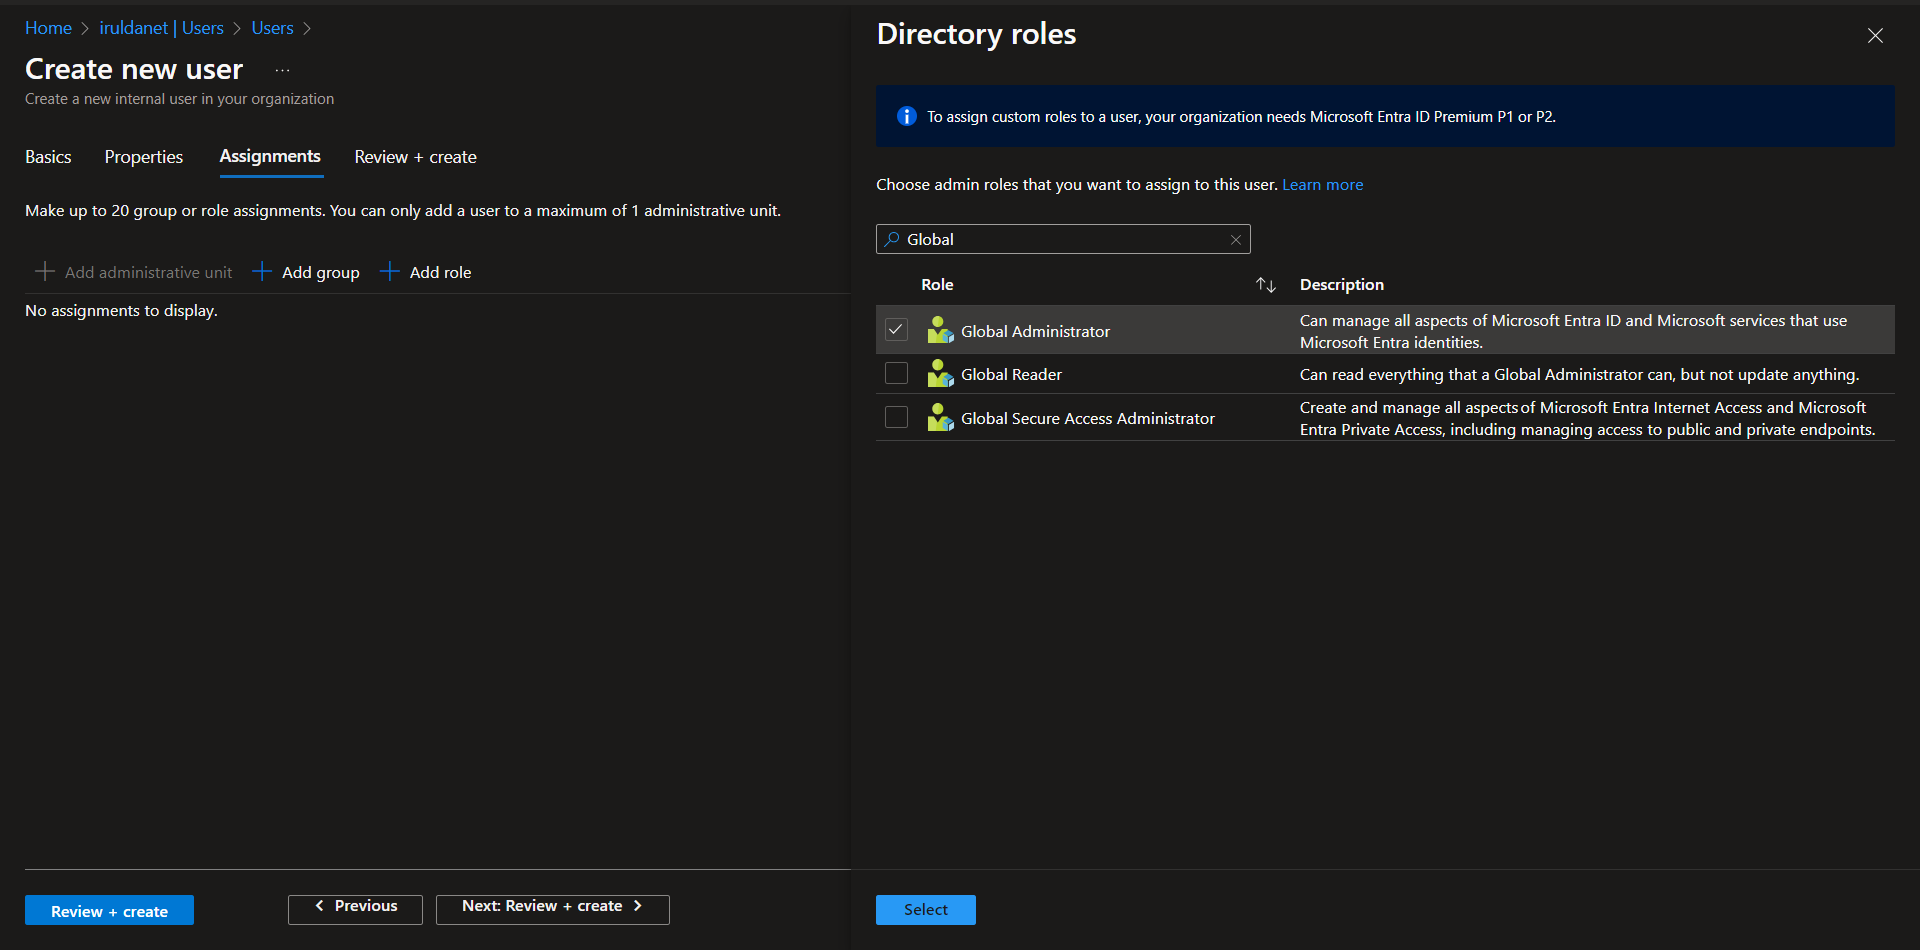
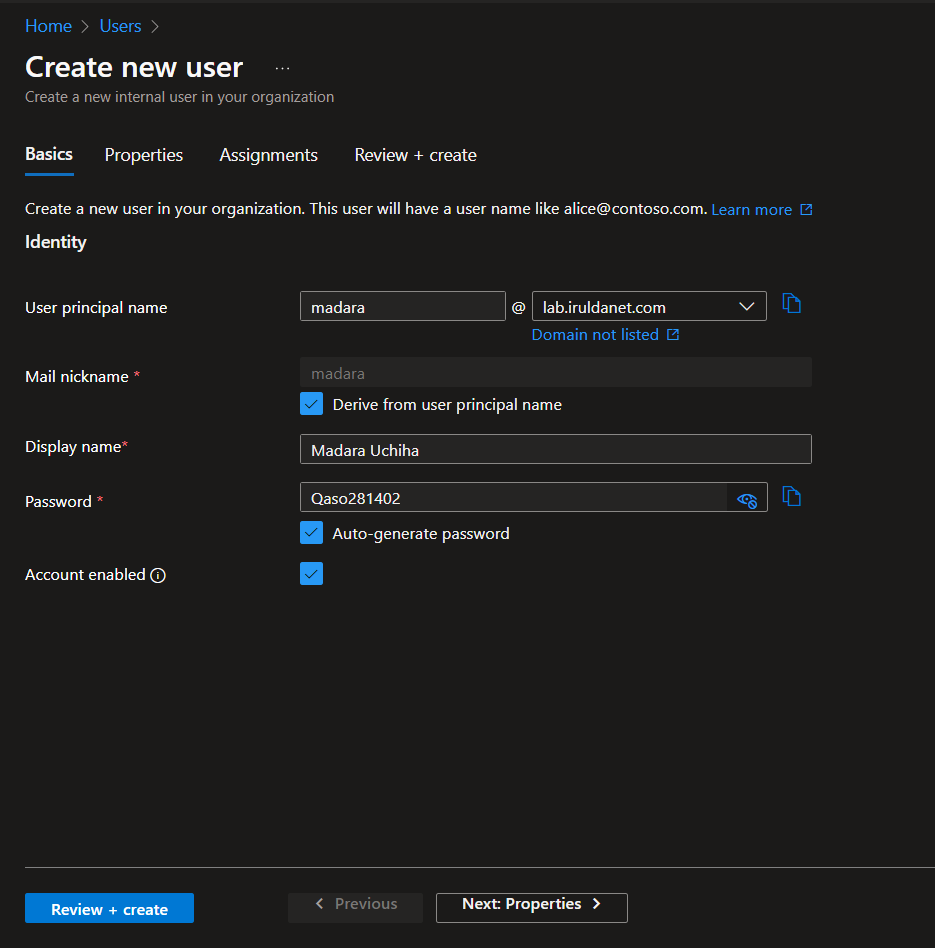
Create a user, assign global admin and use Log Analytics to check that logs are properly being ingested.
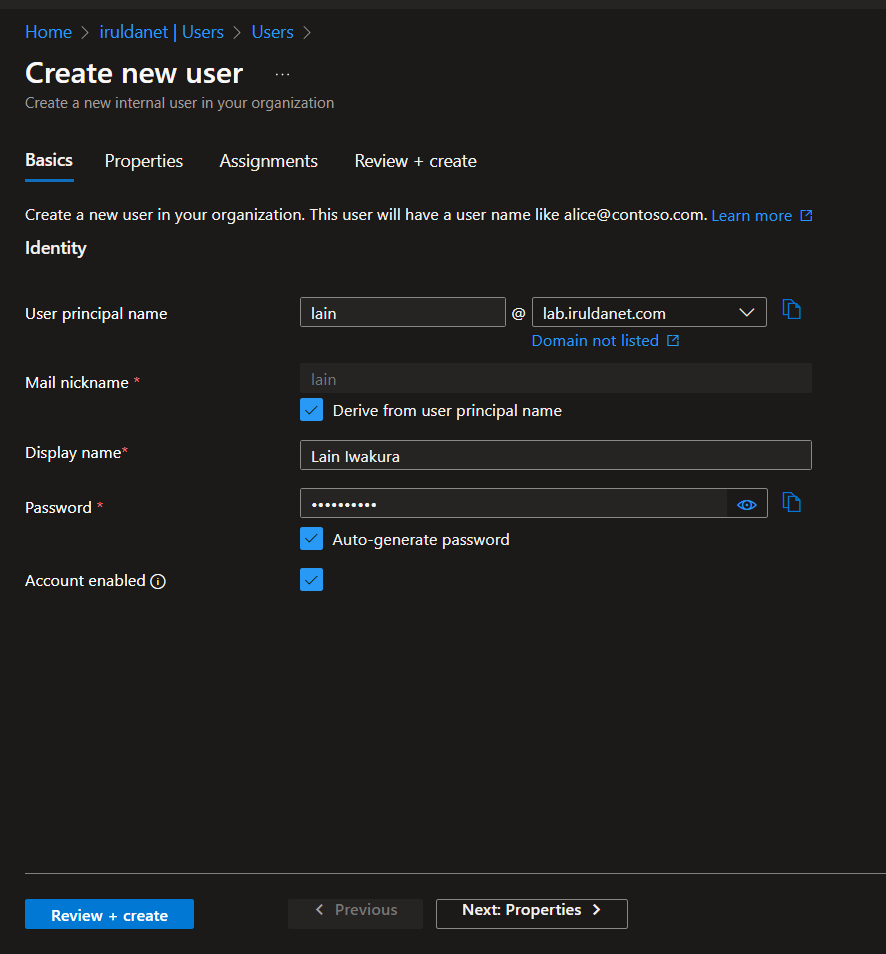
Create an "attacker" user and generate some failed authentication logs by failing to log in 10-20 times.
Note
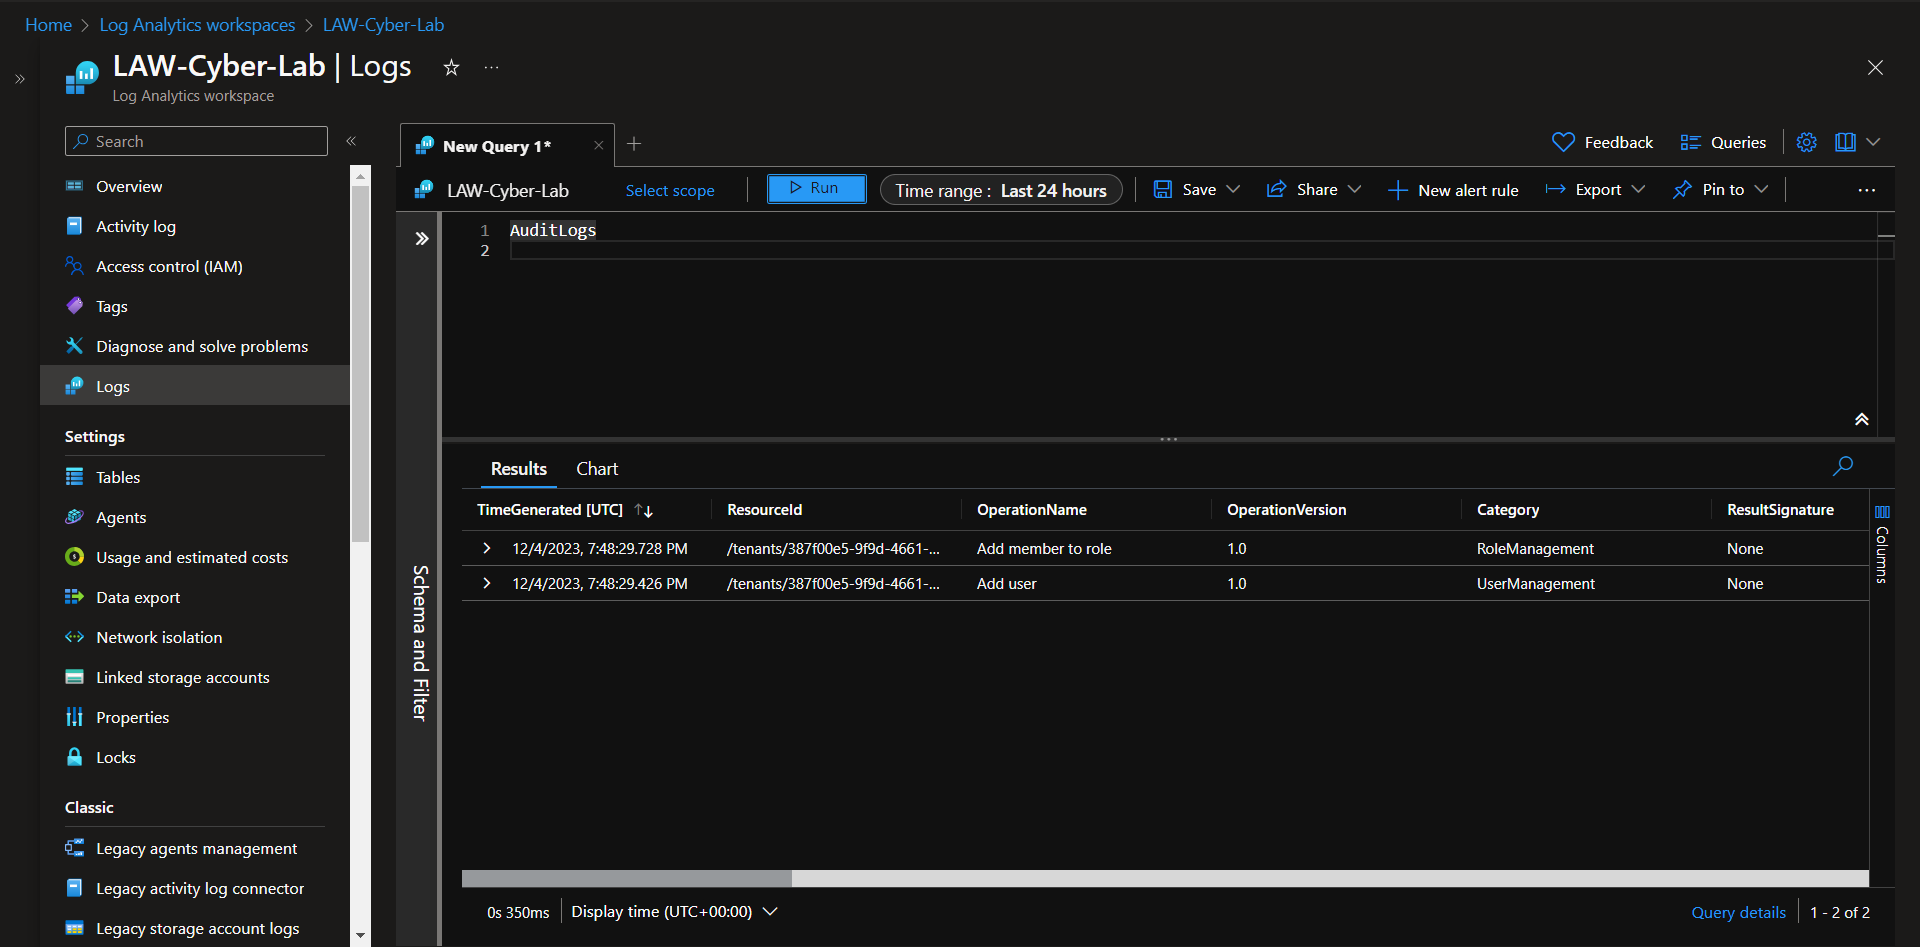
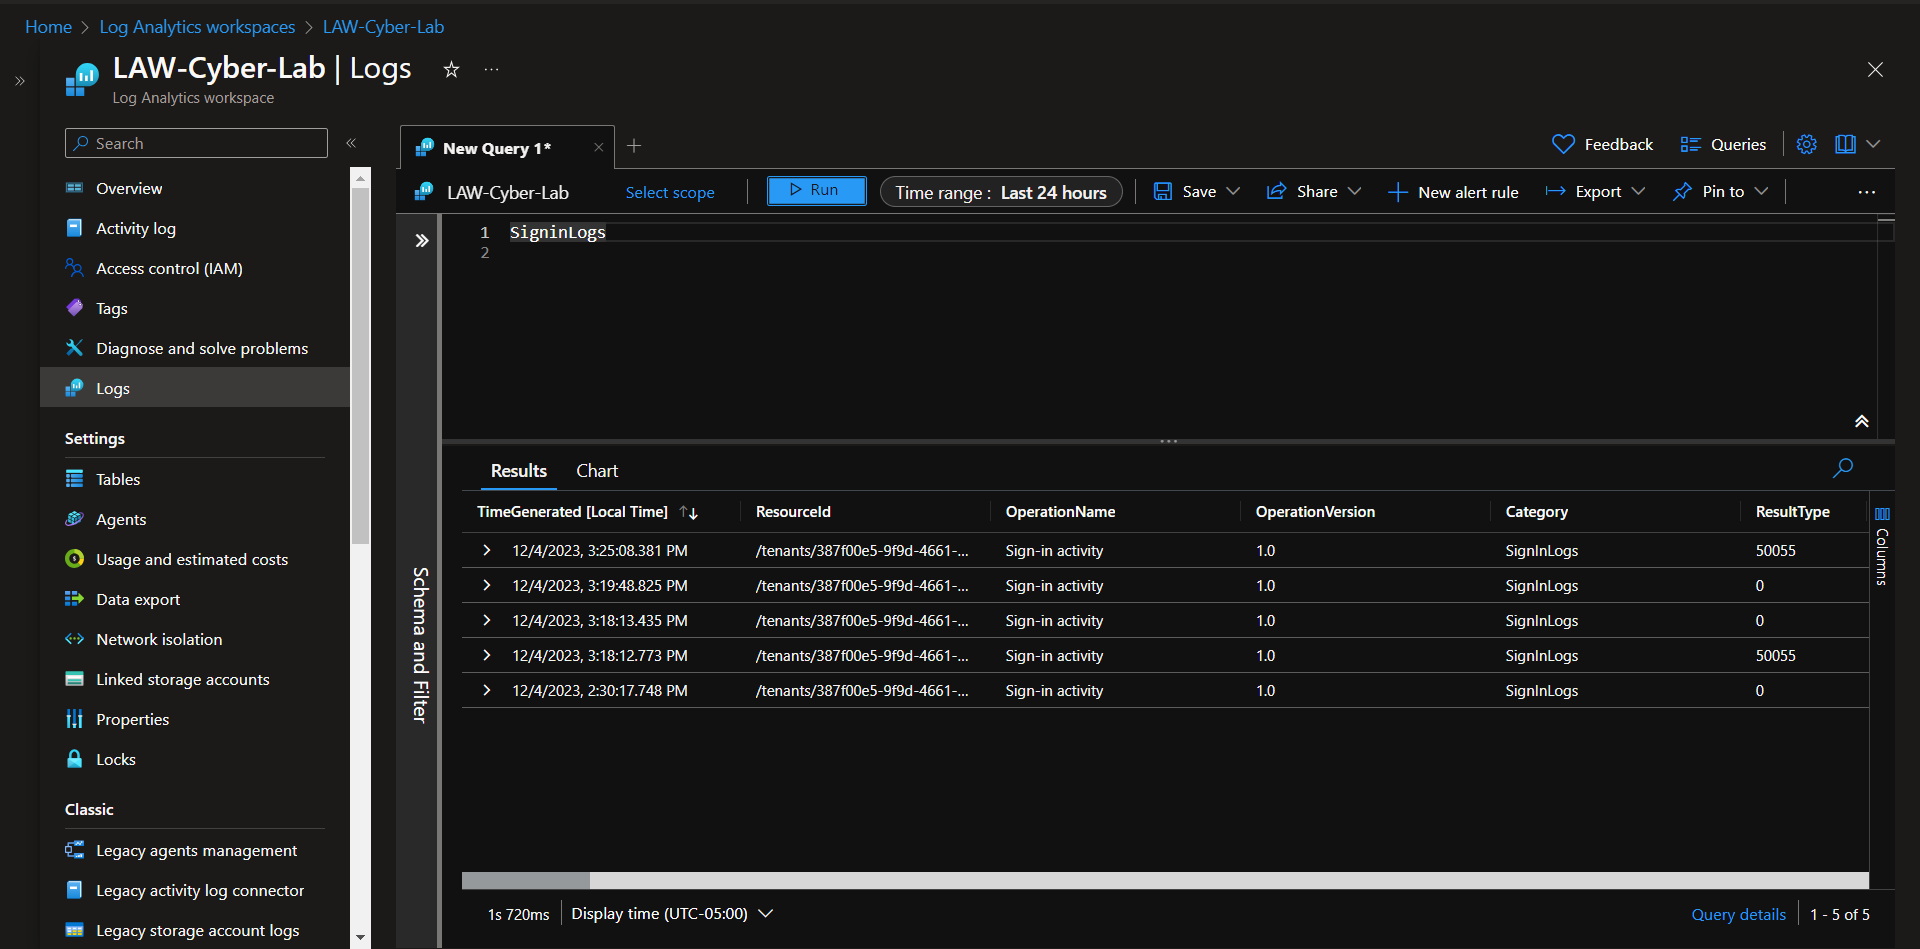
The AuditLogs come in pretty quickly, but the SigninLogs and AzureActivity take a while to come into the Log Analytics Workspace. Generate the logs, then take a 20-30 minute coffee break and query the LAW after.
Audit Logs
Signin Logs
Subscription Level Logging
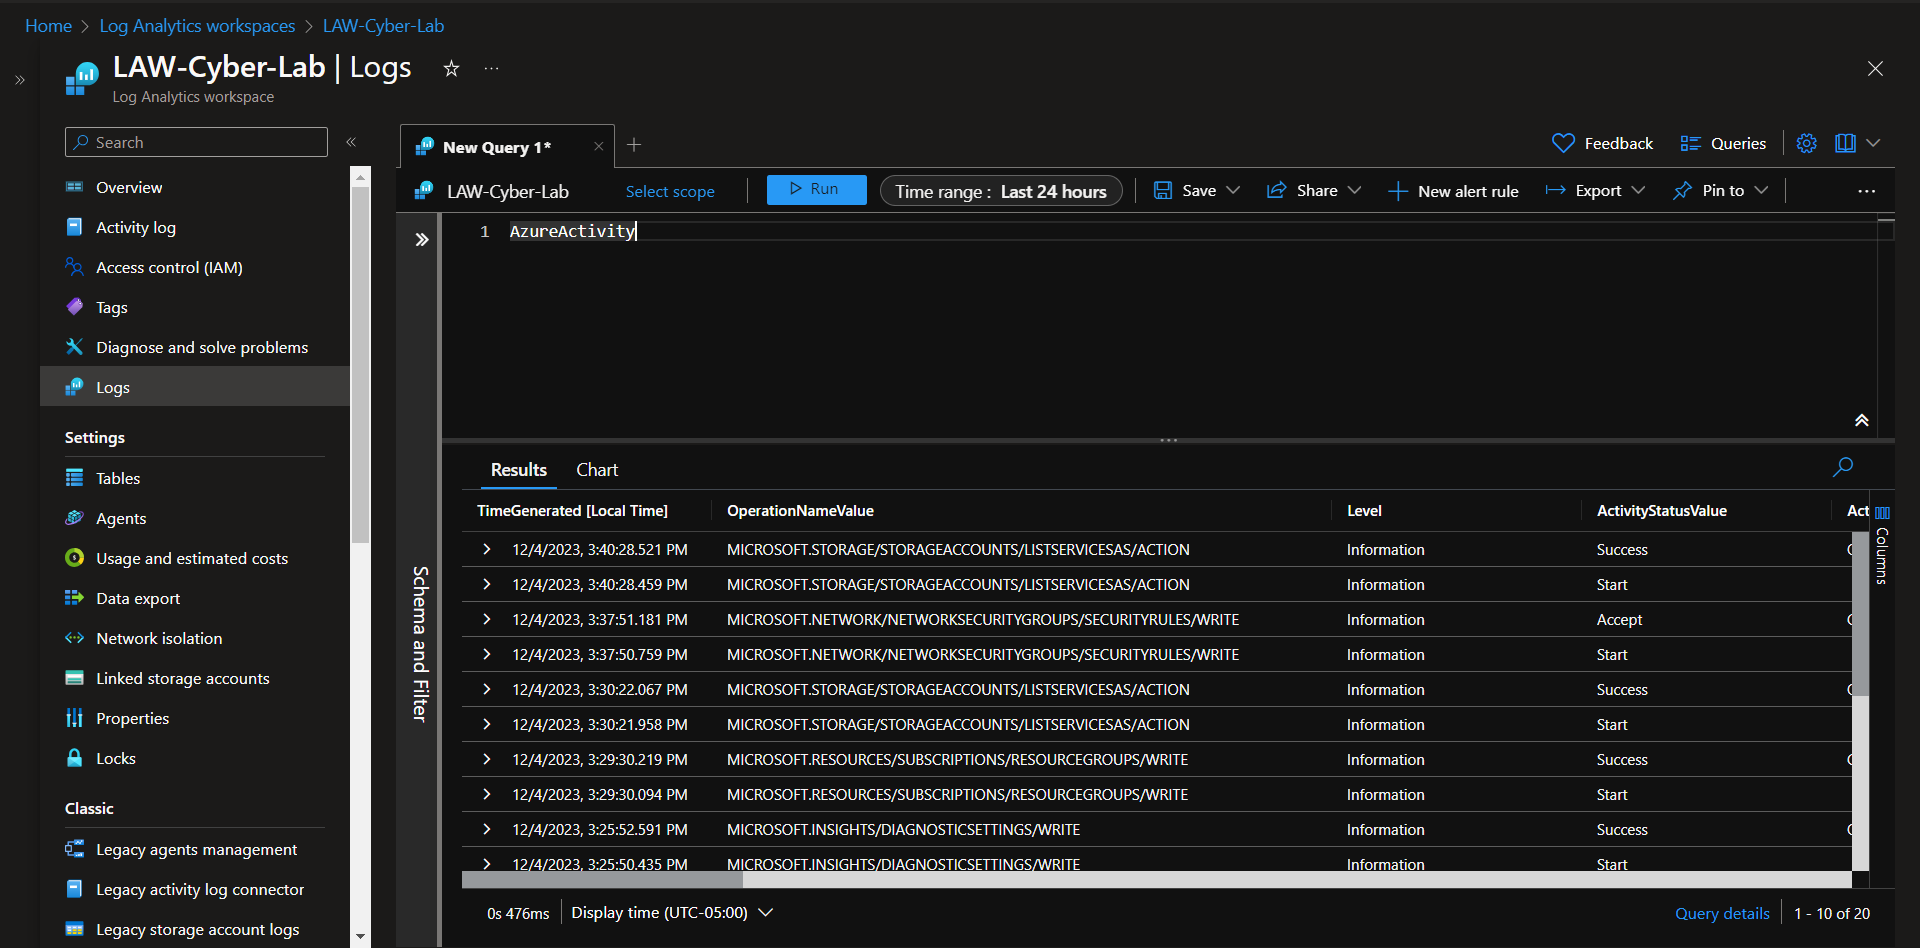
Export Azure Activity Logs to Log Analytics Workspace.
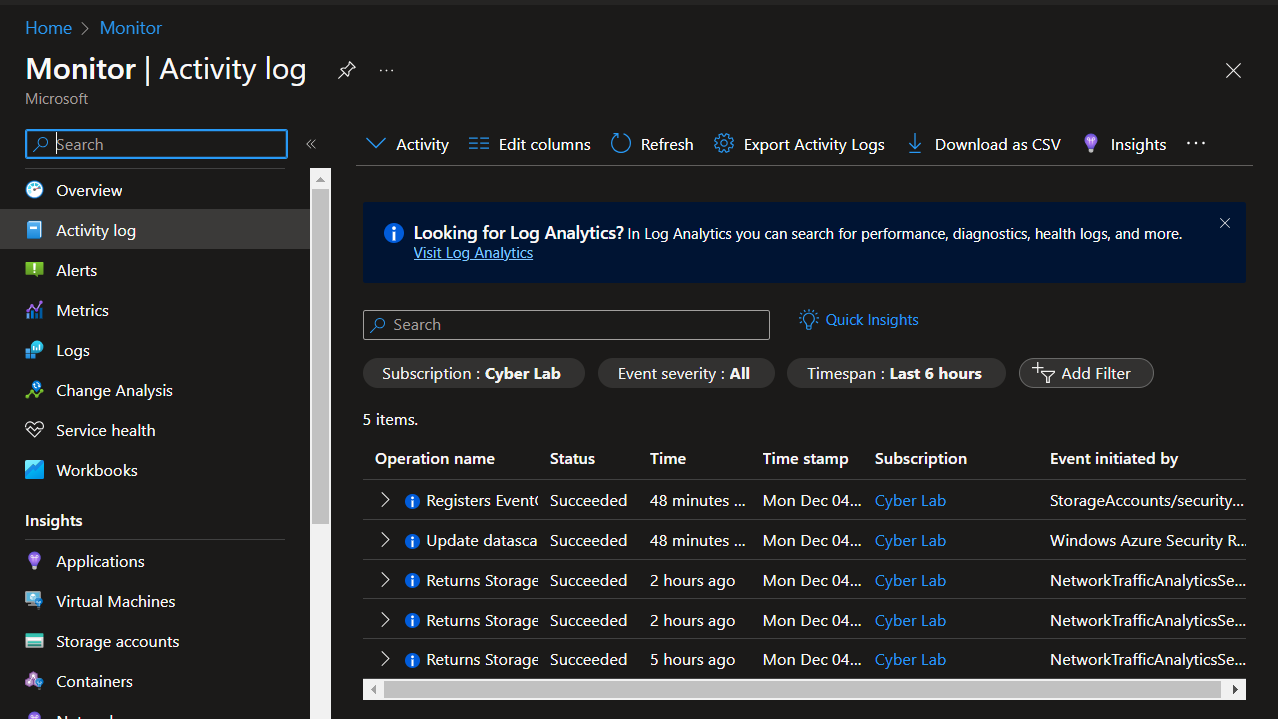
Go to Azure Monitor > Activity Log > Export Activity Logs, create diagnostic settings.
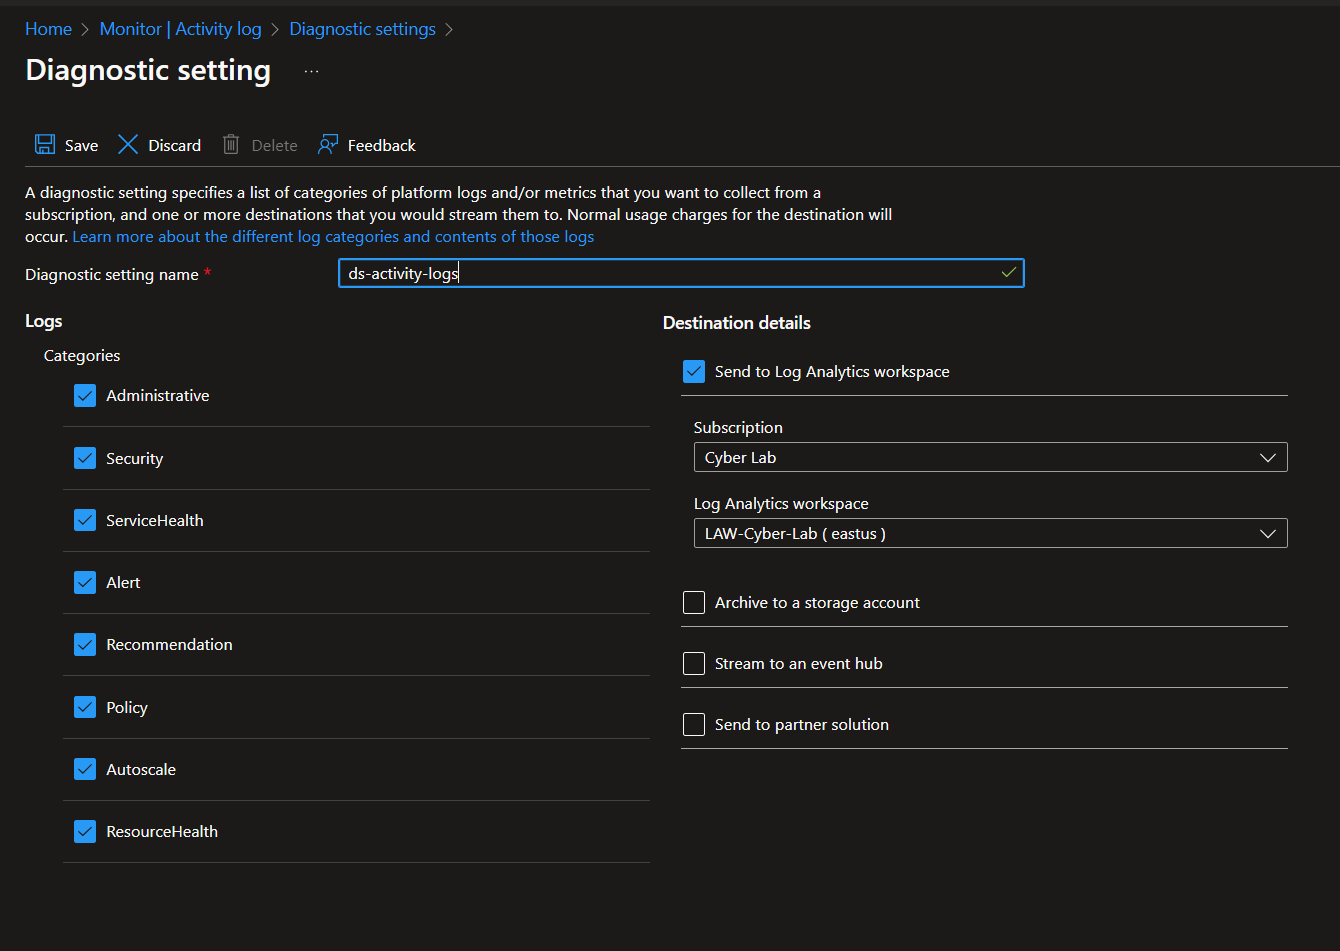
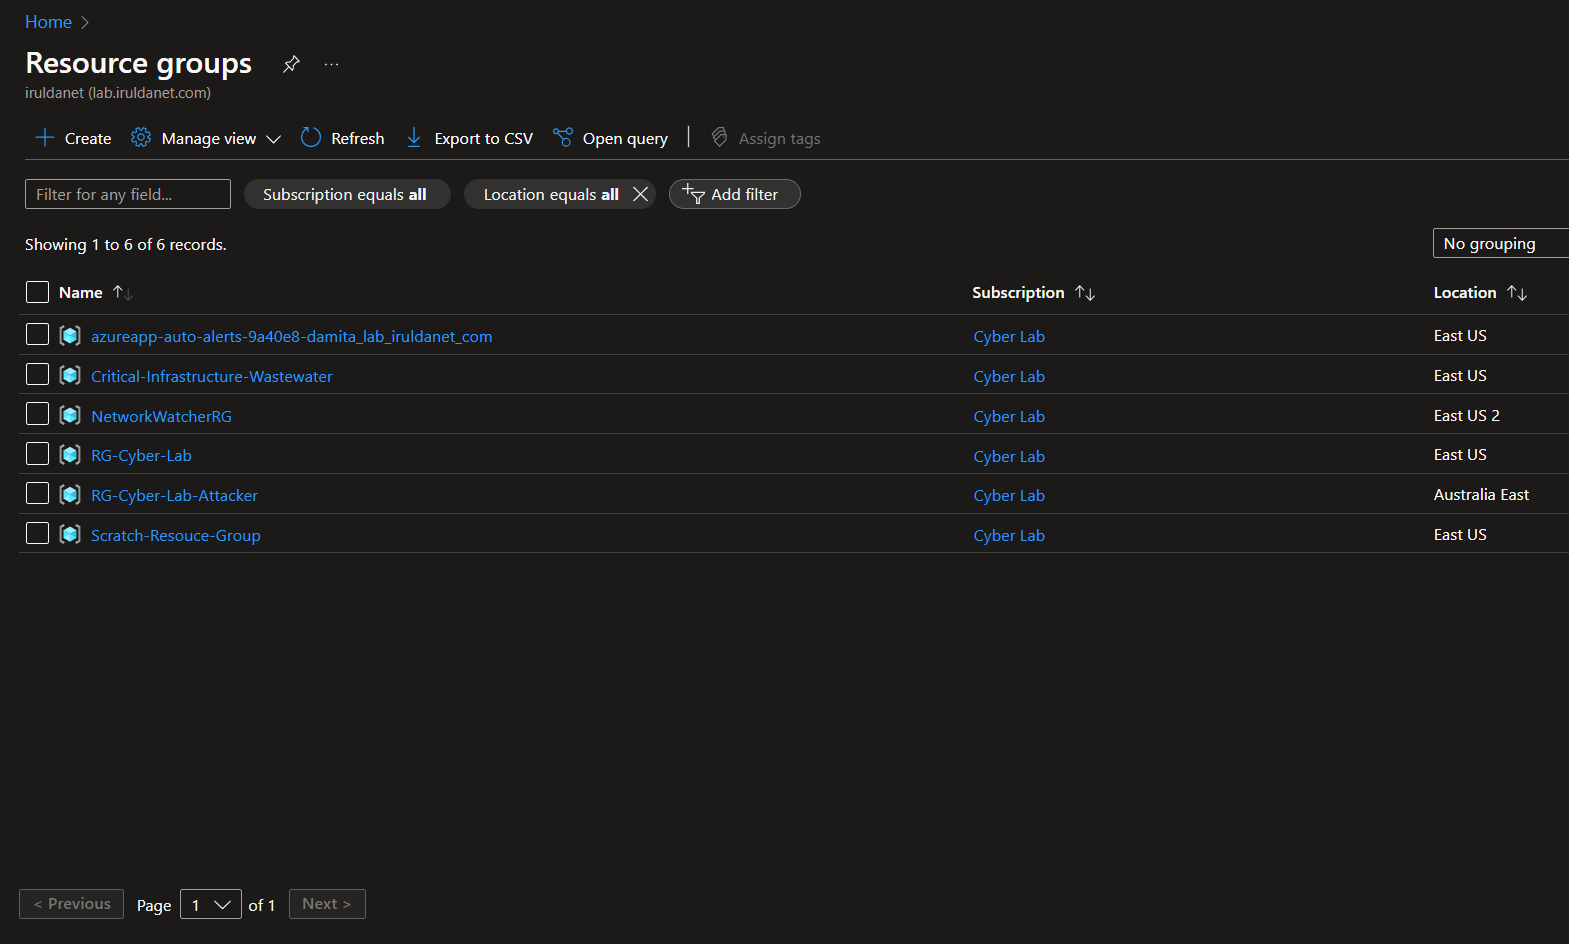
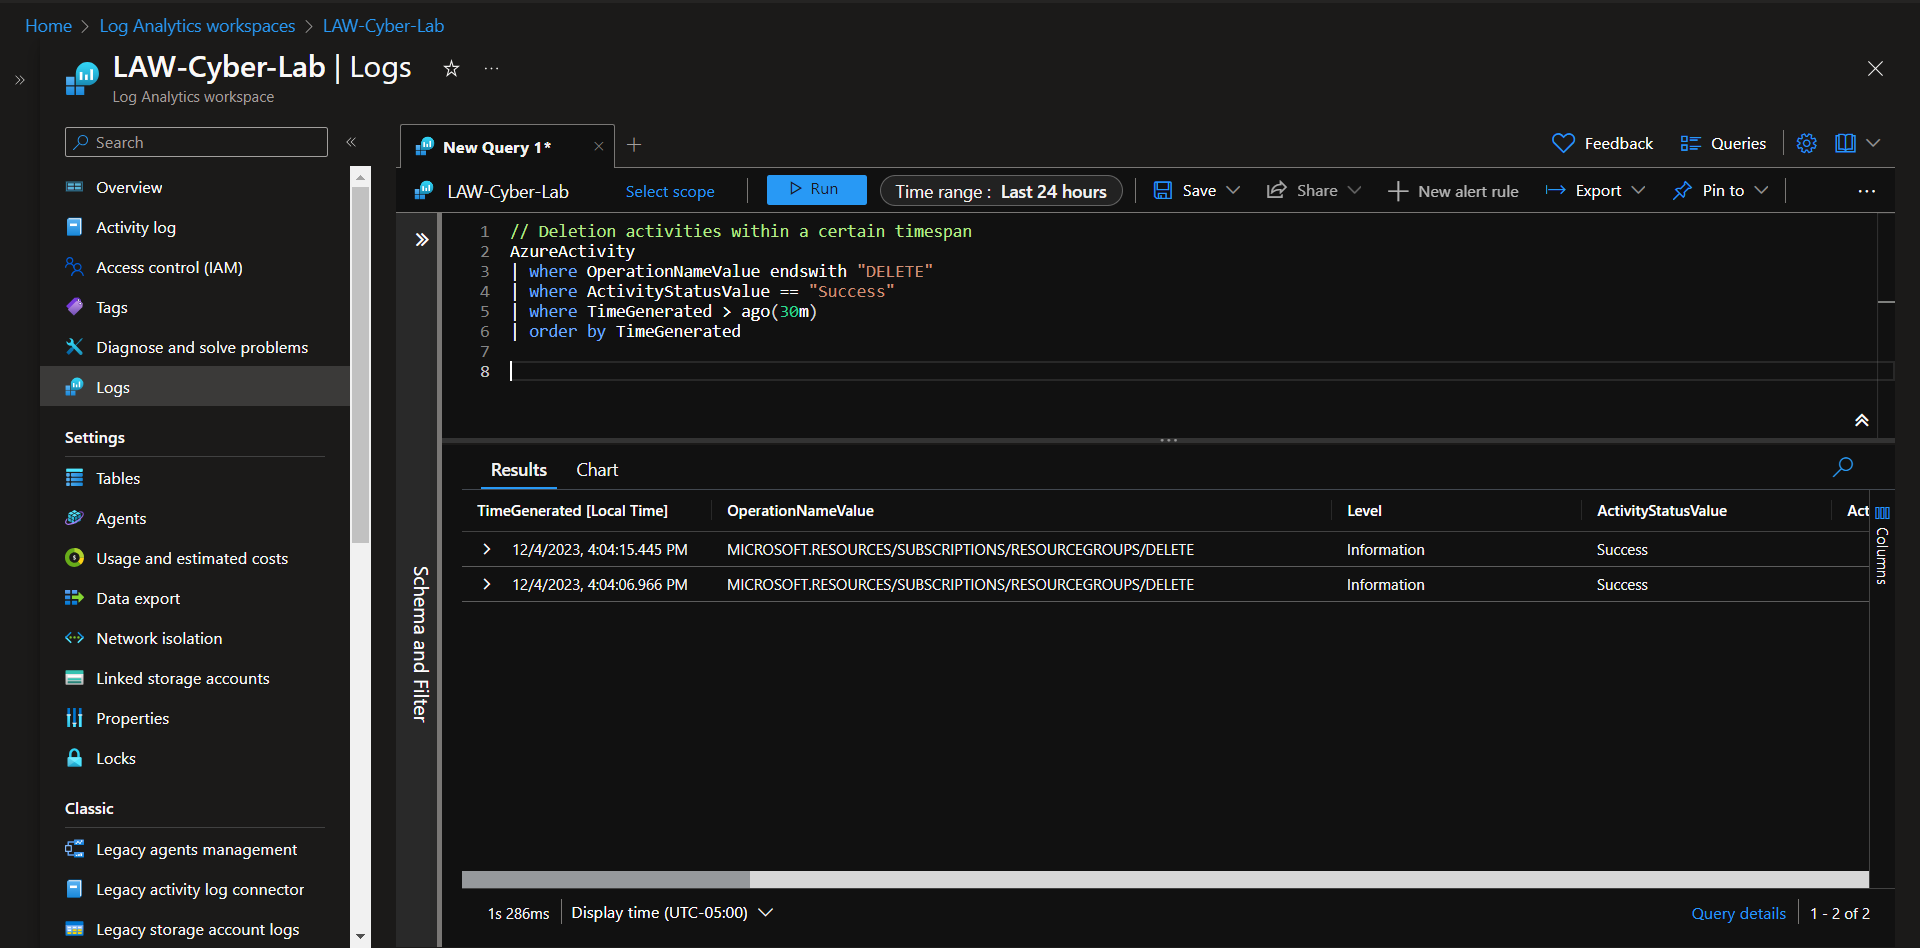
Generate some logs to confirm functionality. Here, I'm creating two resource groups and changing a NSG, then deleting them after confirming the logs are flowing into the LAW properly.
New Resource Groups
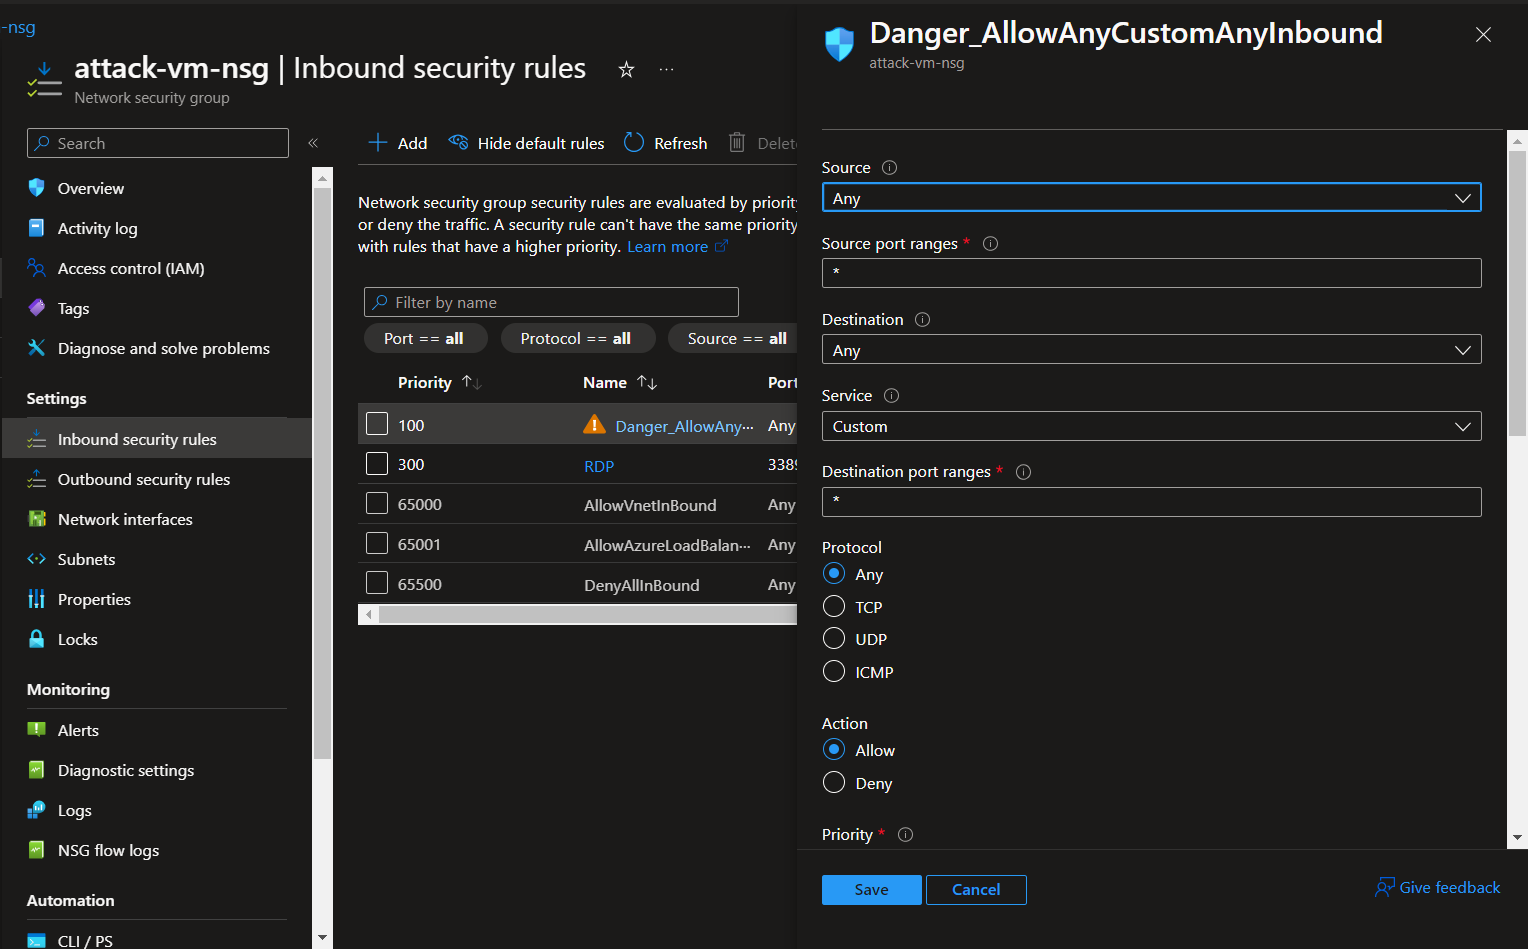
New inbound security rule in attack-vm-nsg
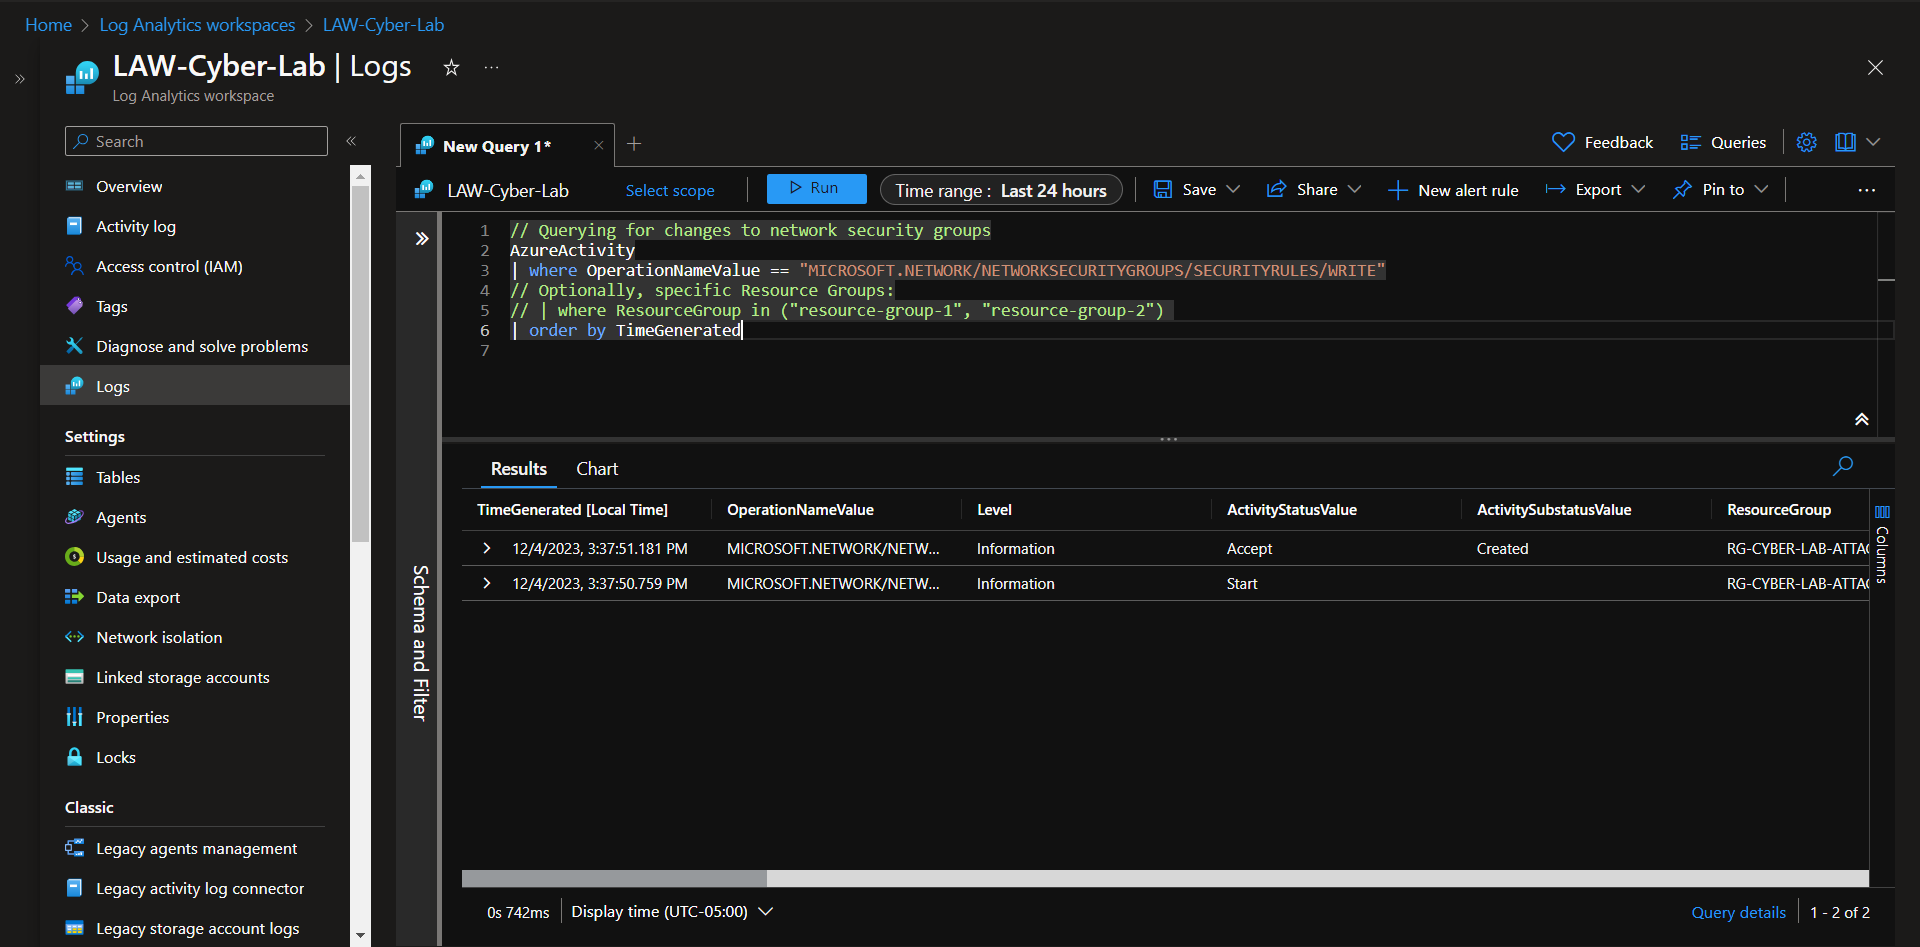
Activity Logs
Checking resource group deletion in logs
Resource Level Logging (Data Plane Logs)
Storage Account
Enable logs for storage account and key vault.
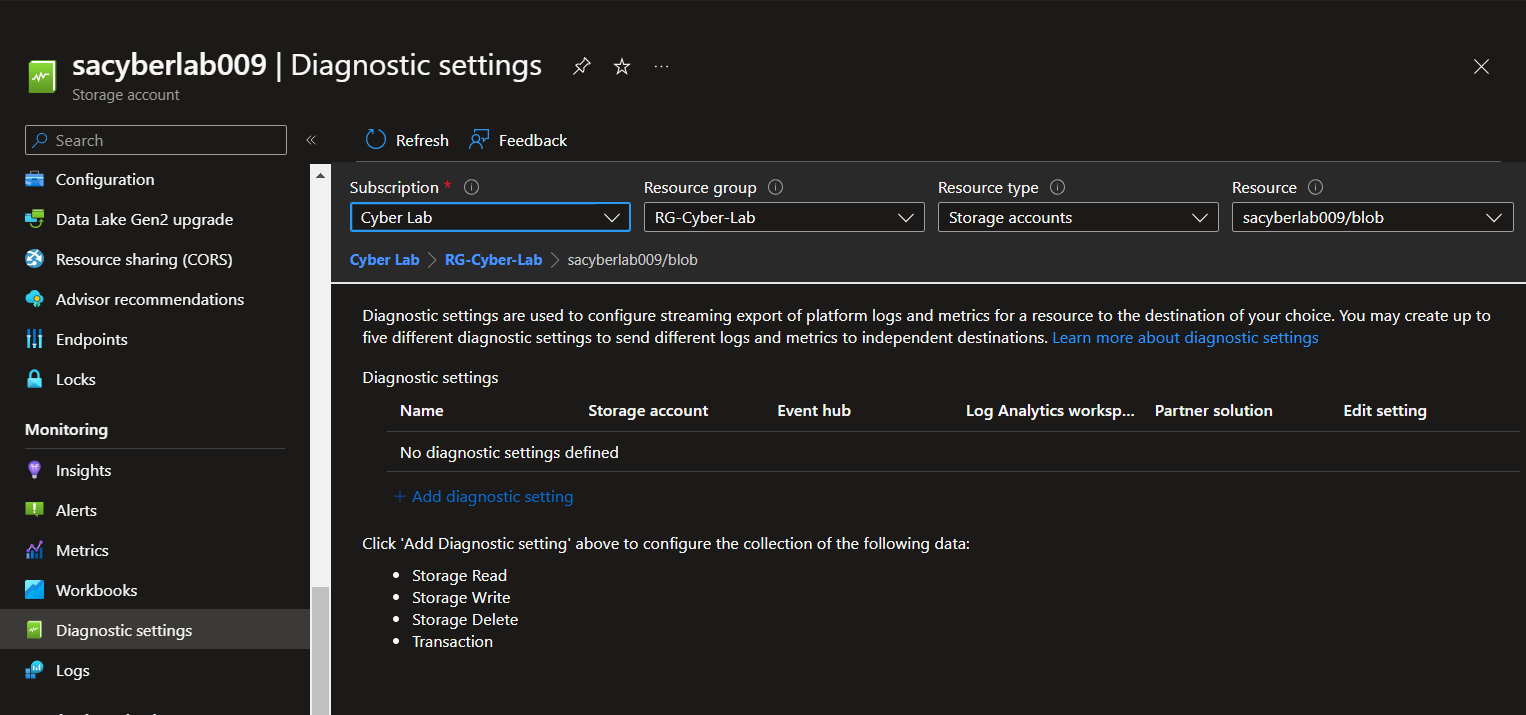
Storage Accounts > Select Storage Account > Under Monitoring, select Diagnostic Settings
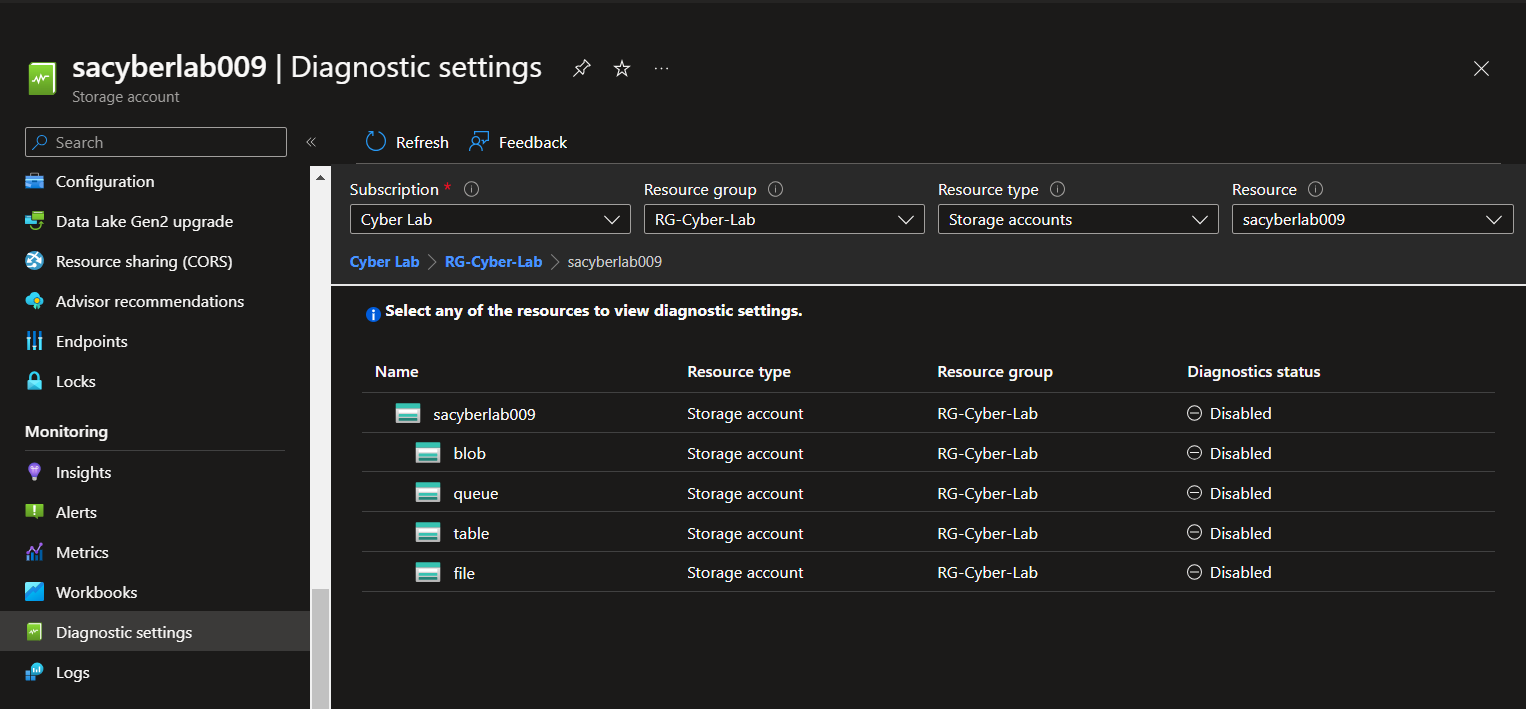
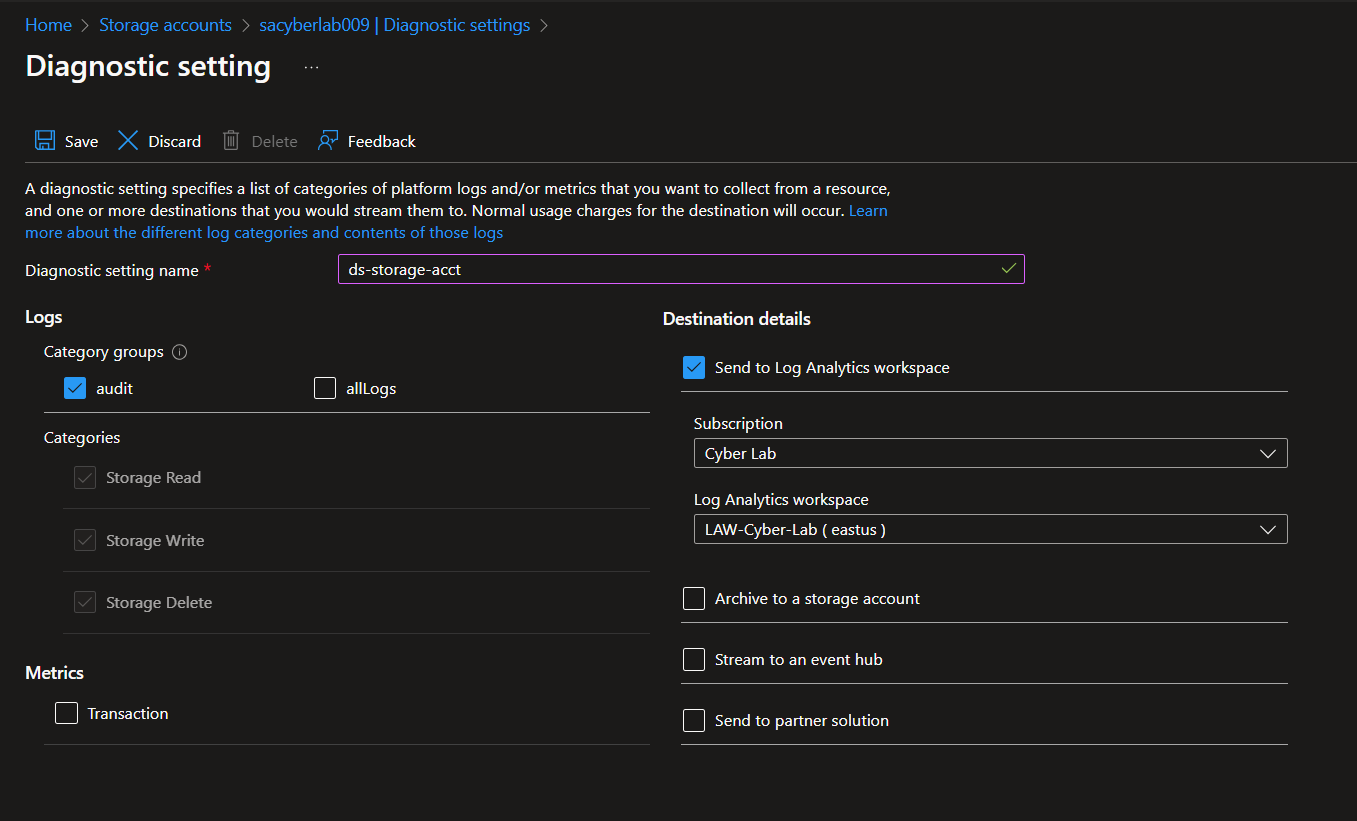
Click 'Disabled' next to 'blob' > Add Diagnostic setting > Select Audit, create name for setting > Save
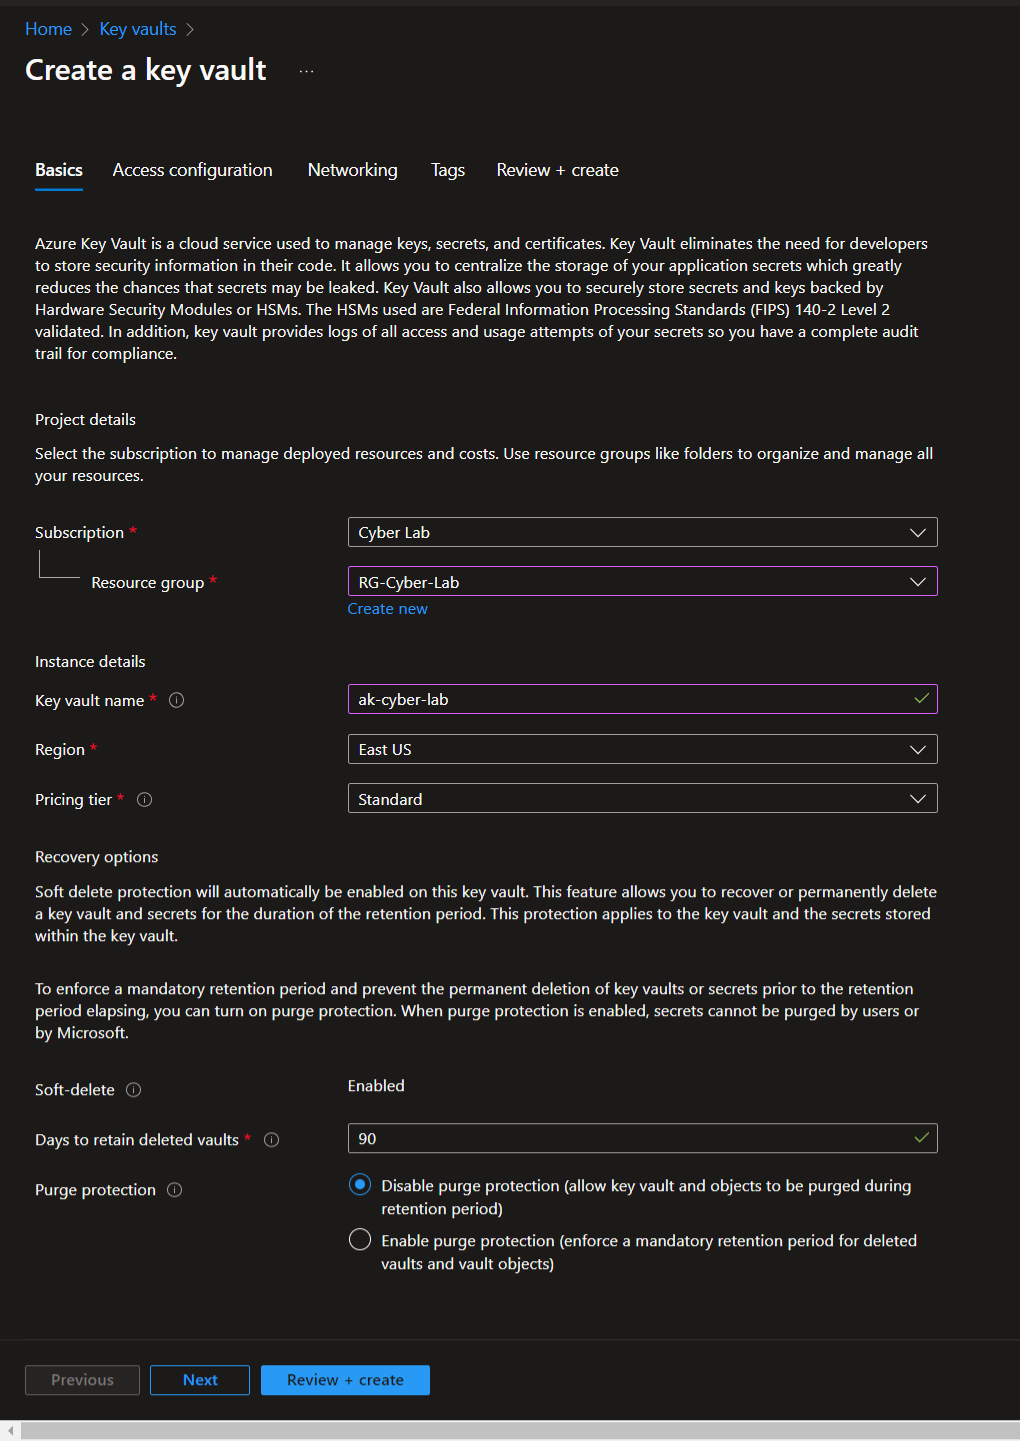
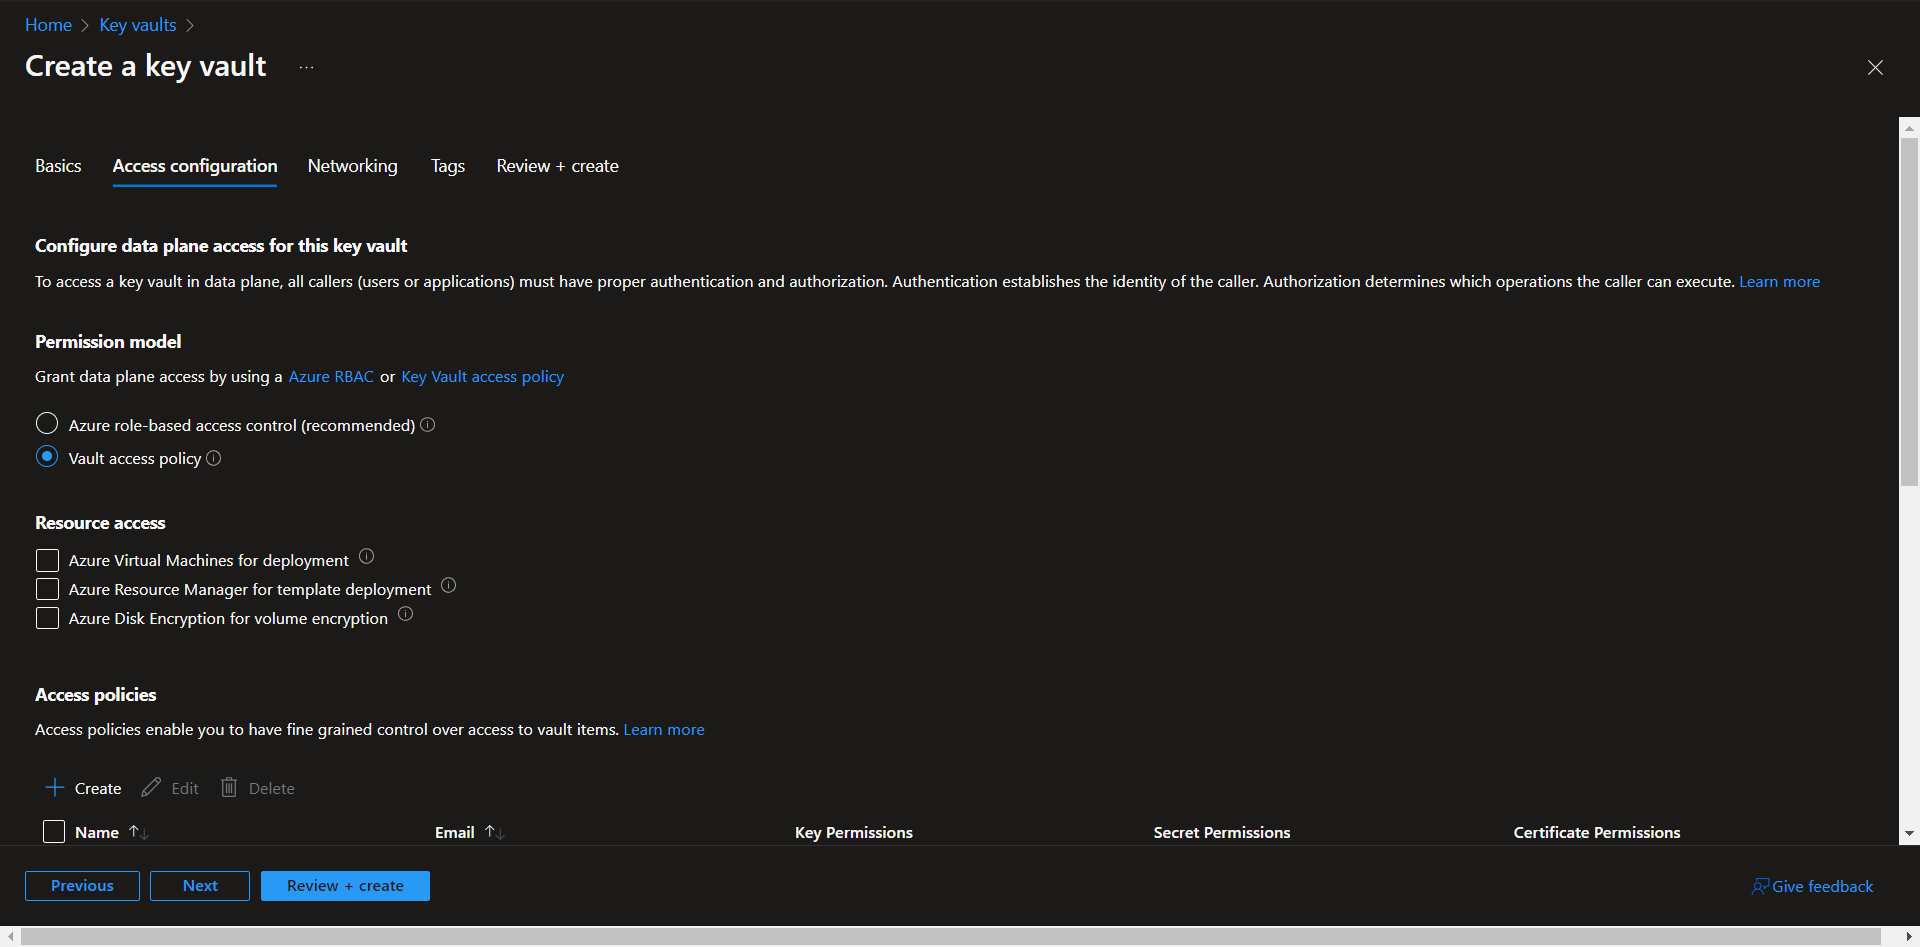
Azure Key Vault
Navigate to Azure Key Vault > Create a Key Vault or use one you already have, just make sure it is in the same resource group as the other resources. Name must be globally unique.
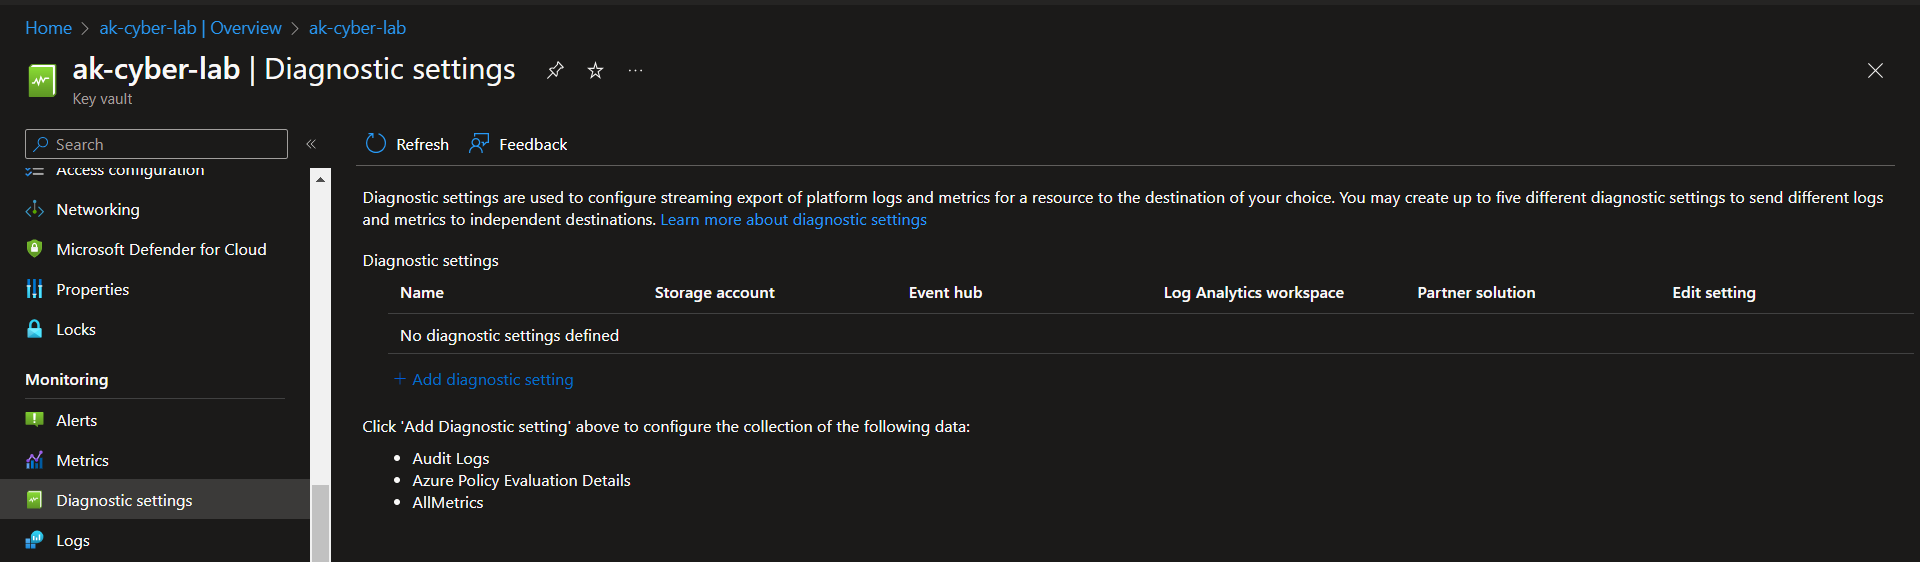
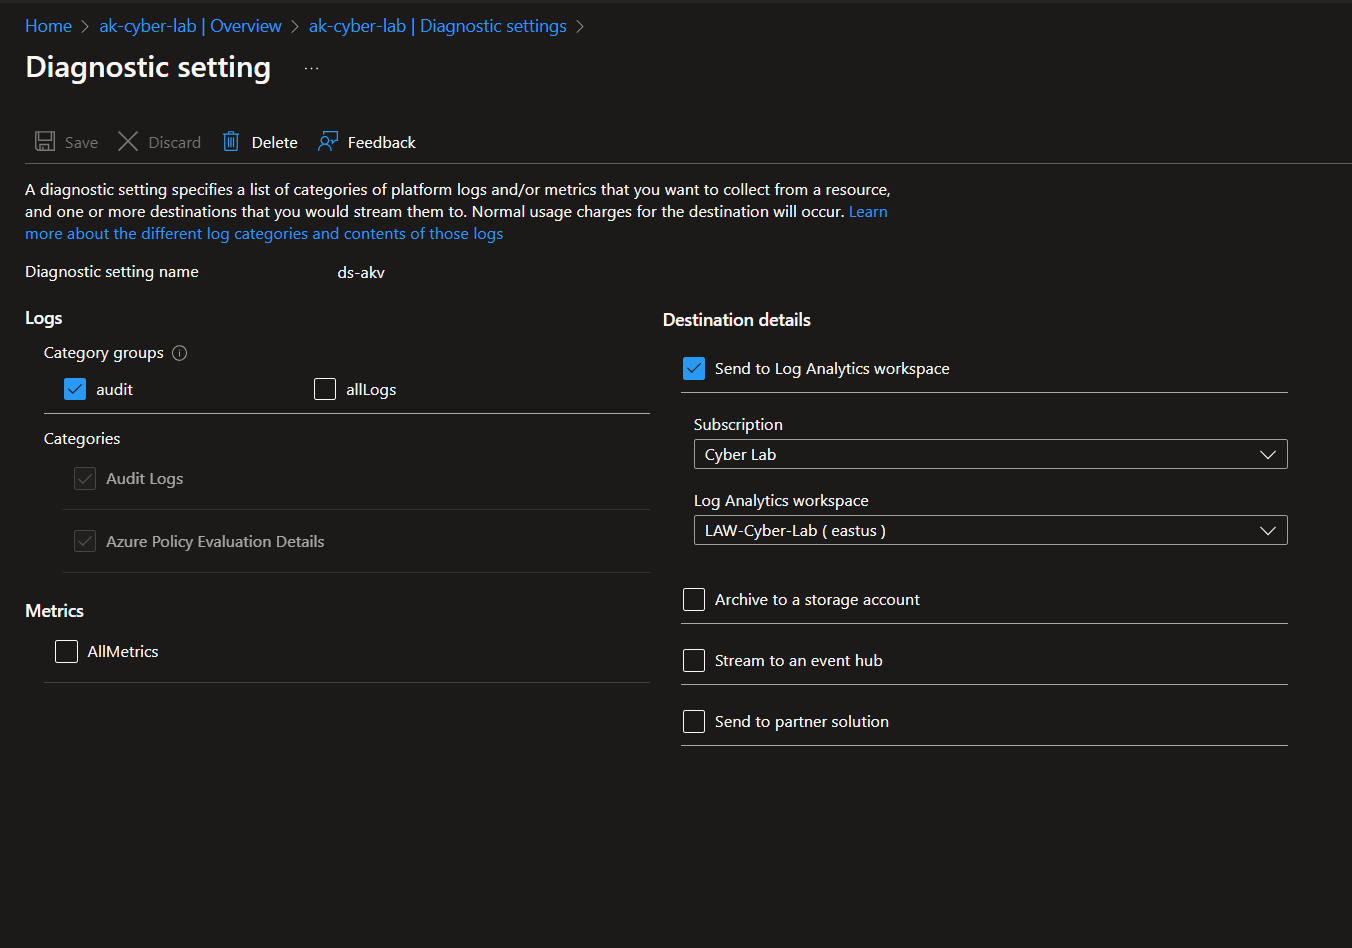
Create a Diagnostic Setting for LAW
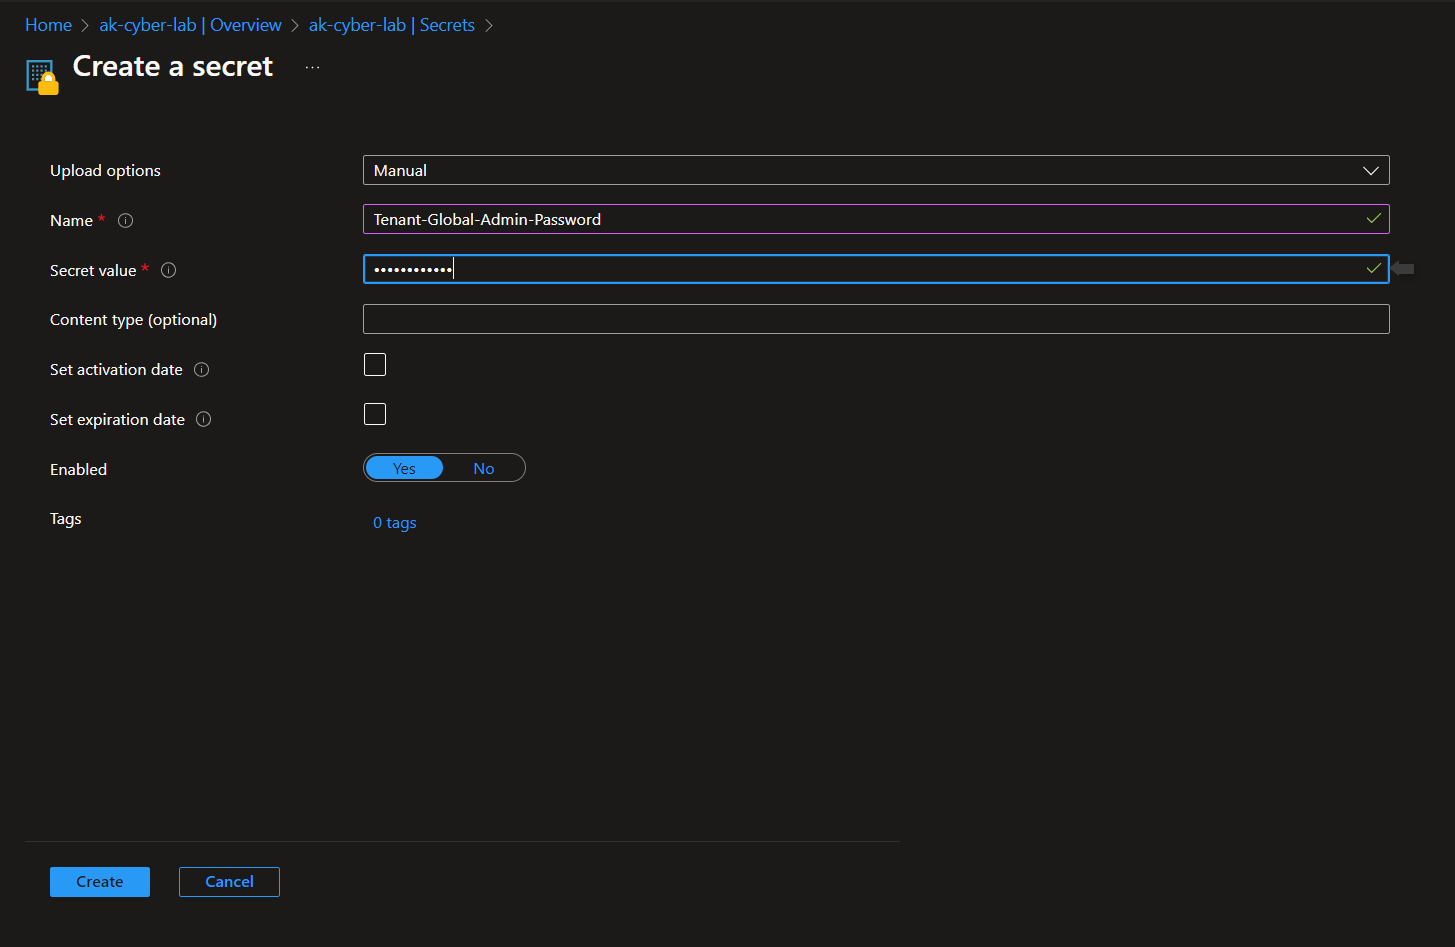
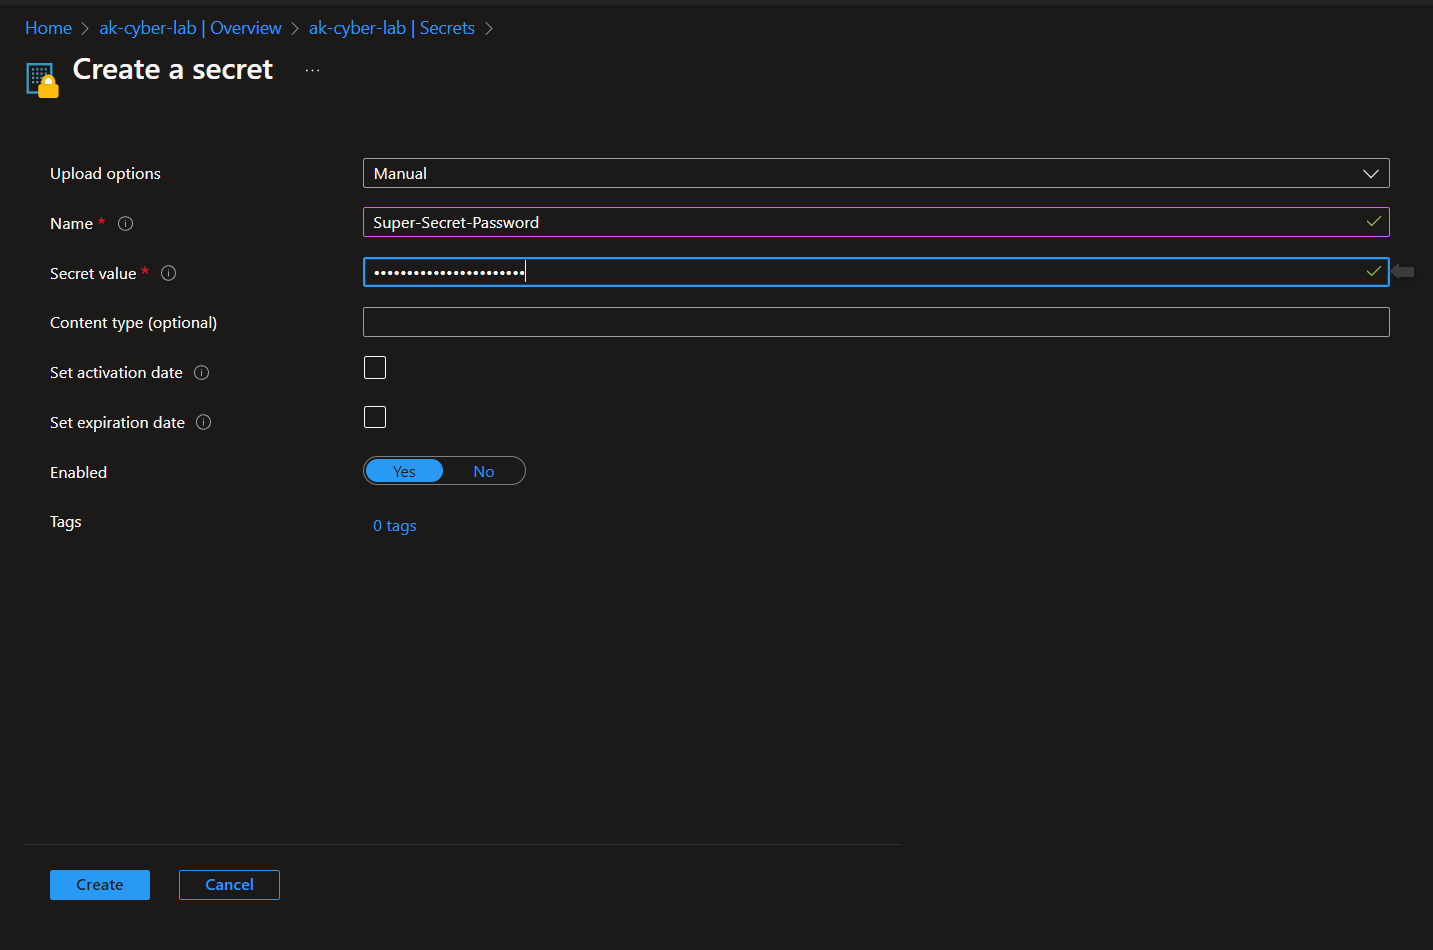
Next, generate some logs by creating a few secrets and viewing them.
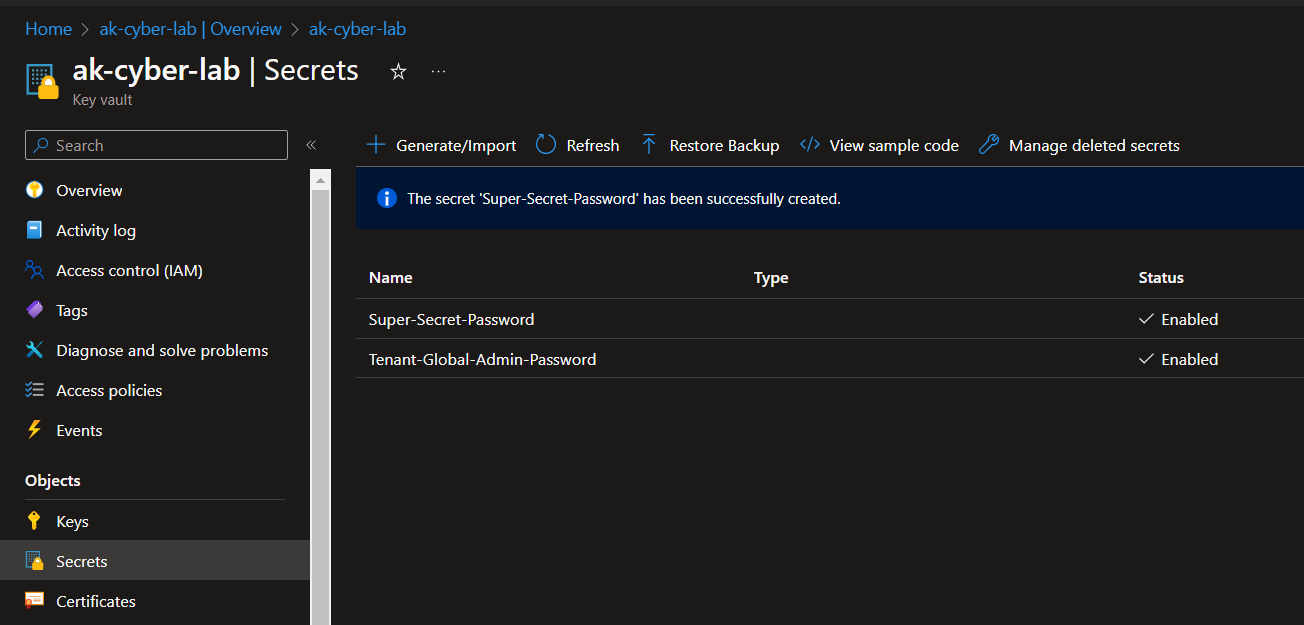
Query LAW to make sure logs are flowing from resources:
Configure Microsoft Sentinel
World Attack Maps Construction
This is the point where we can create attack maps for the following use cases:
- Failed Authentication in Windows (RDP/SMB)
- Failed Authentication in Linux (SSH)
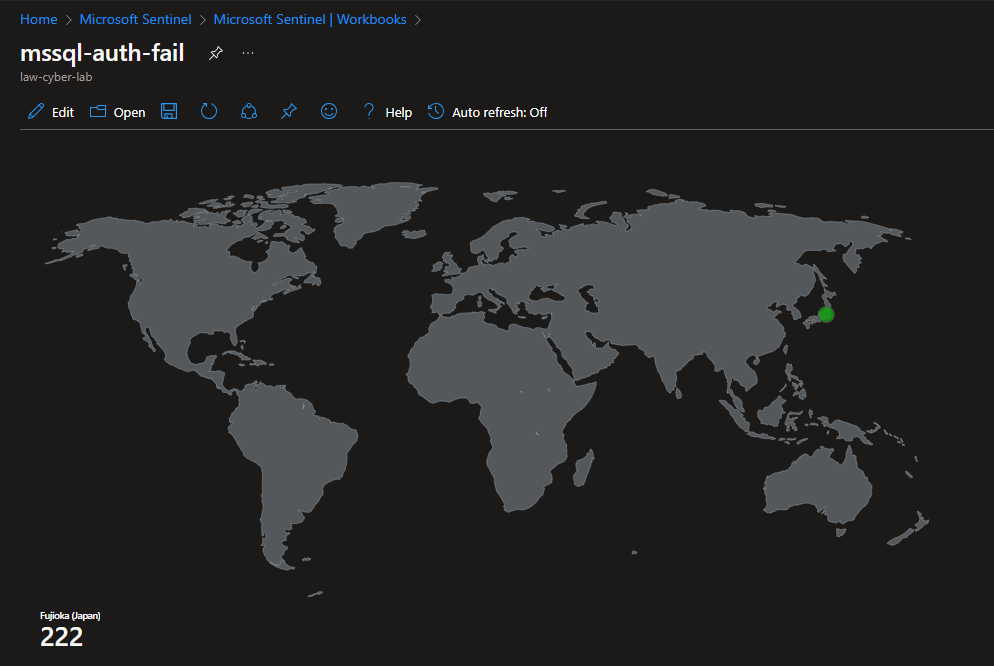
- Failed Authentication to the Microsoft SQL Server
- Malicious Flows to the Network Security Groups
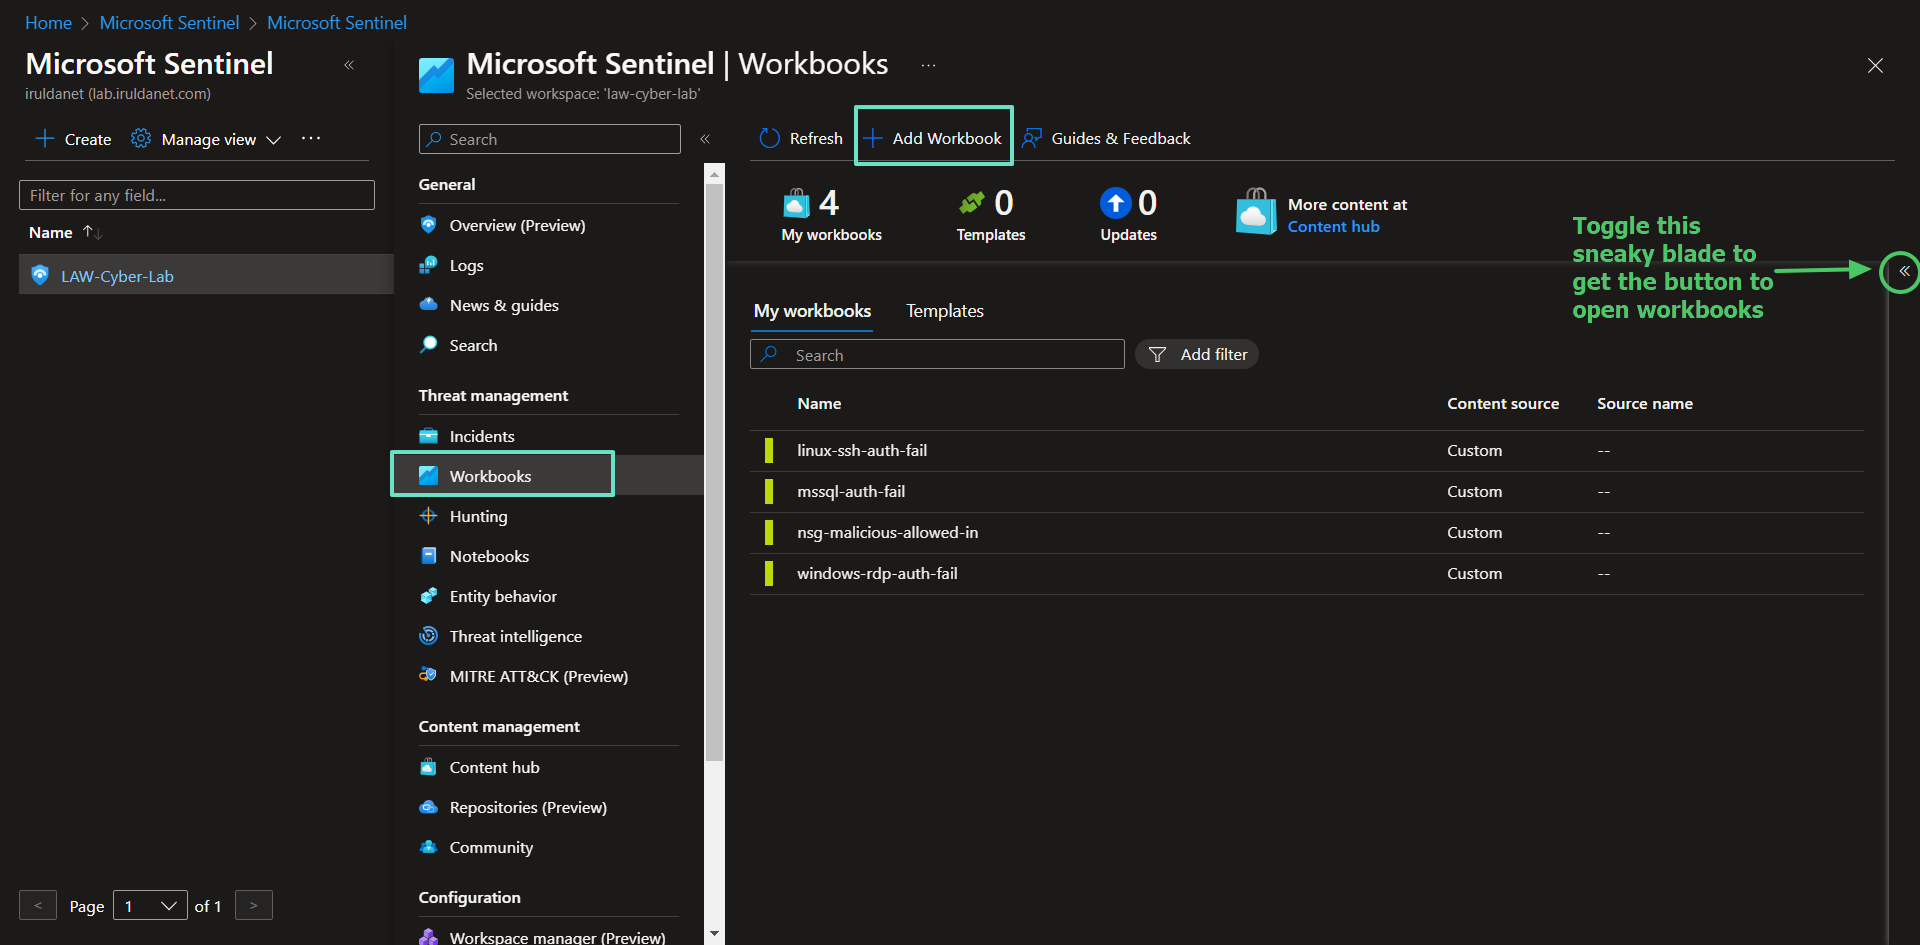
Go to Microsoft Sentinel > Workbooks > Add Workbook > Edit > Delete default analytics query > Add query > Advanced Editor > Add json query here > Save and name workbook.
If you want to test the query, to see if events will be plotted on the map. Exit the Advanced Editor and grab the query from the main Edit page, then use it to query the logs in LAW.
For example, this is the query from the Microsoft SQL Server failed authentication workbook in LAW:
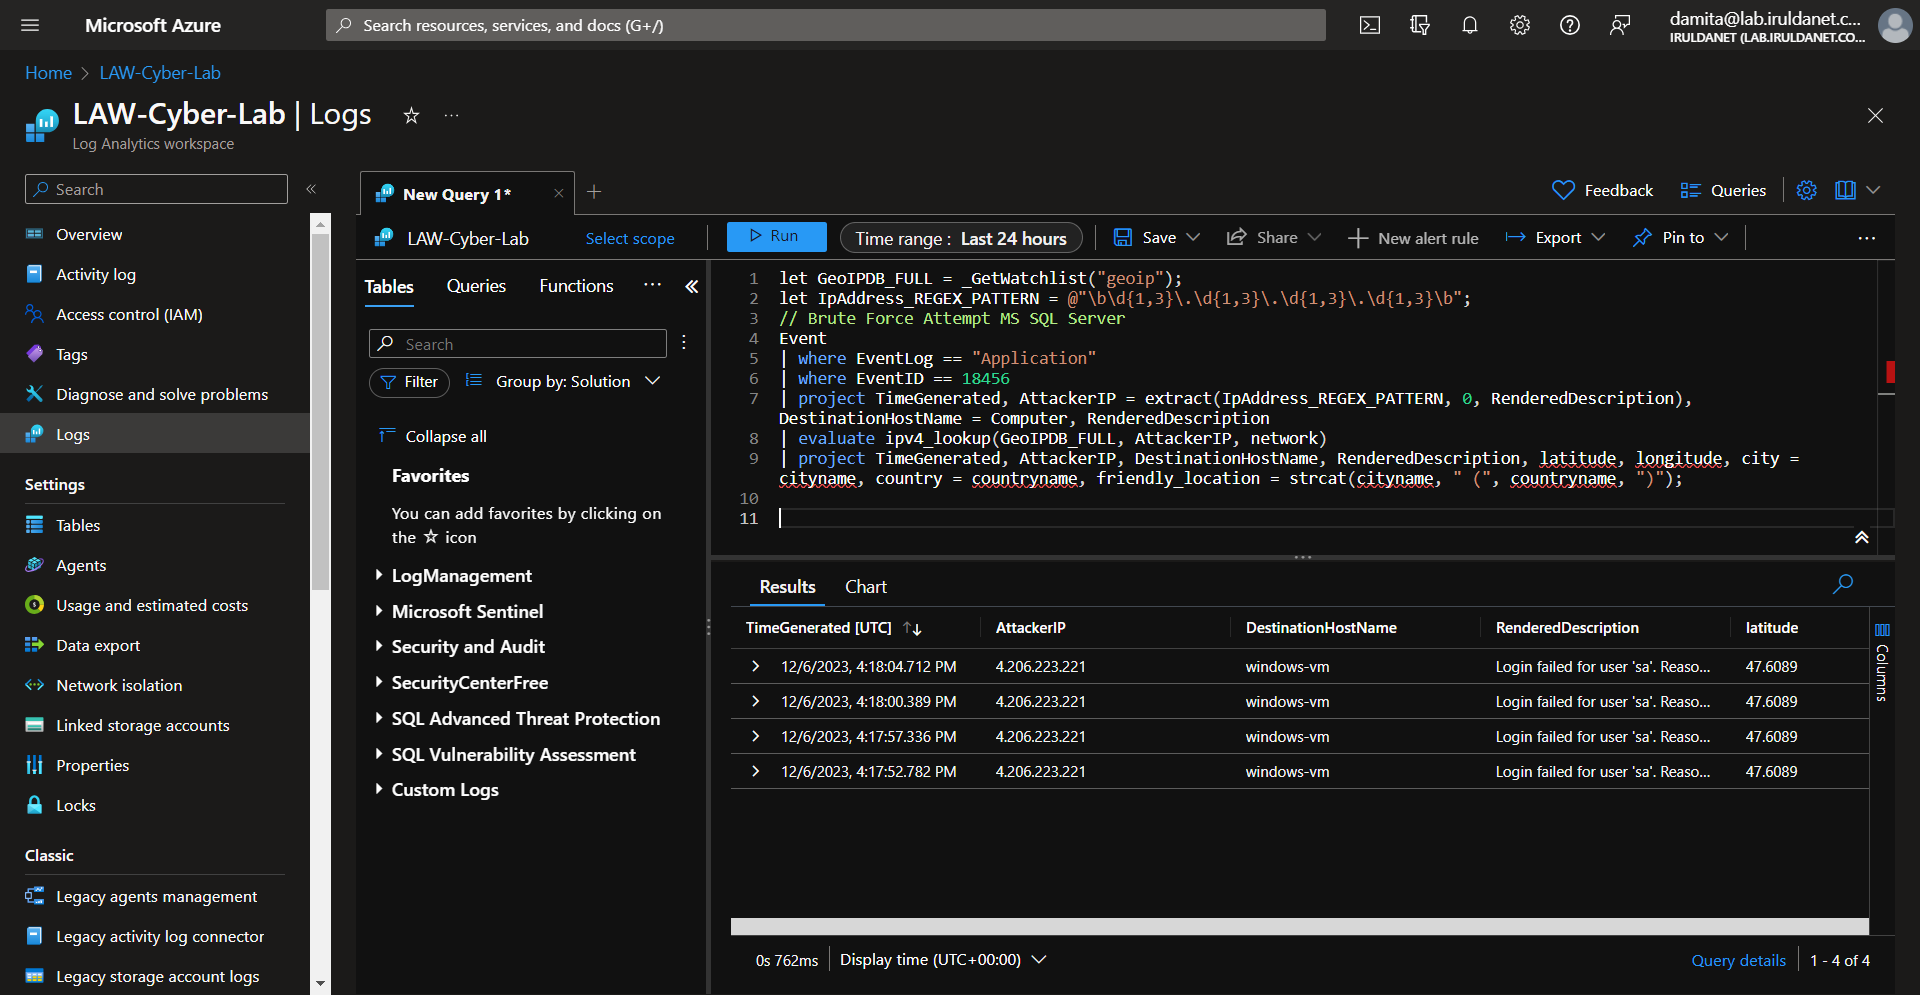
By doing this, you can test changes to the query and make sure it works and is generating desired results before updating the workbooks in Sentinel.
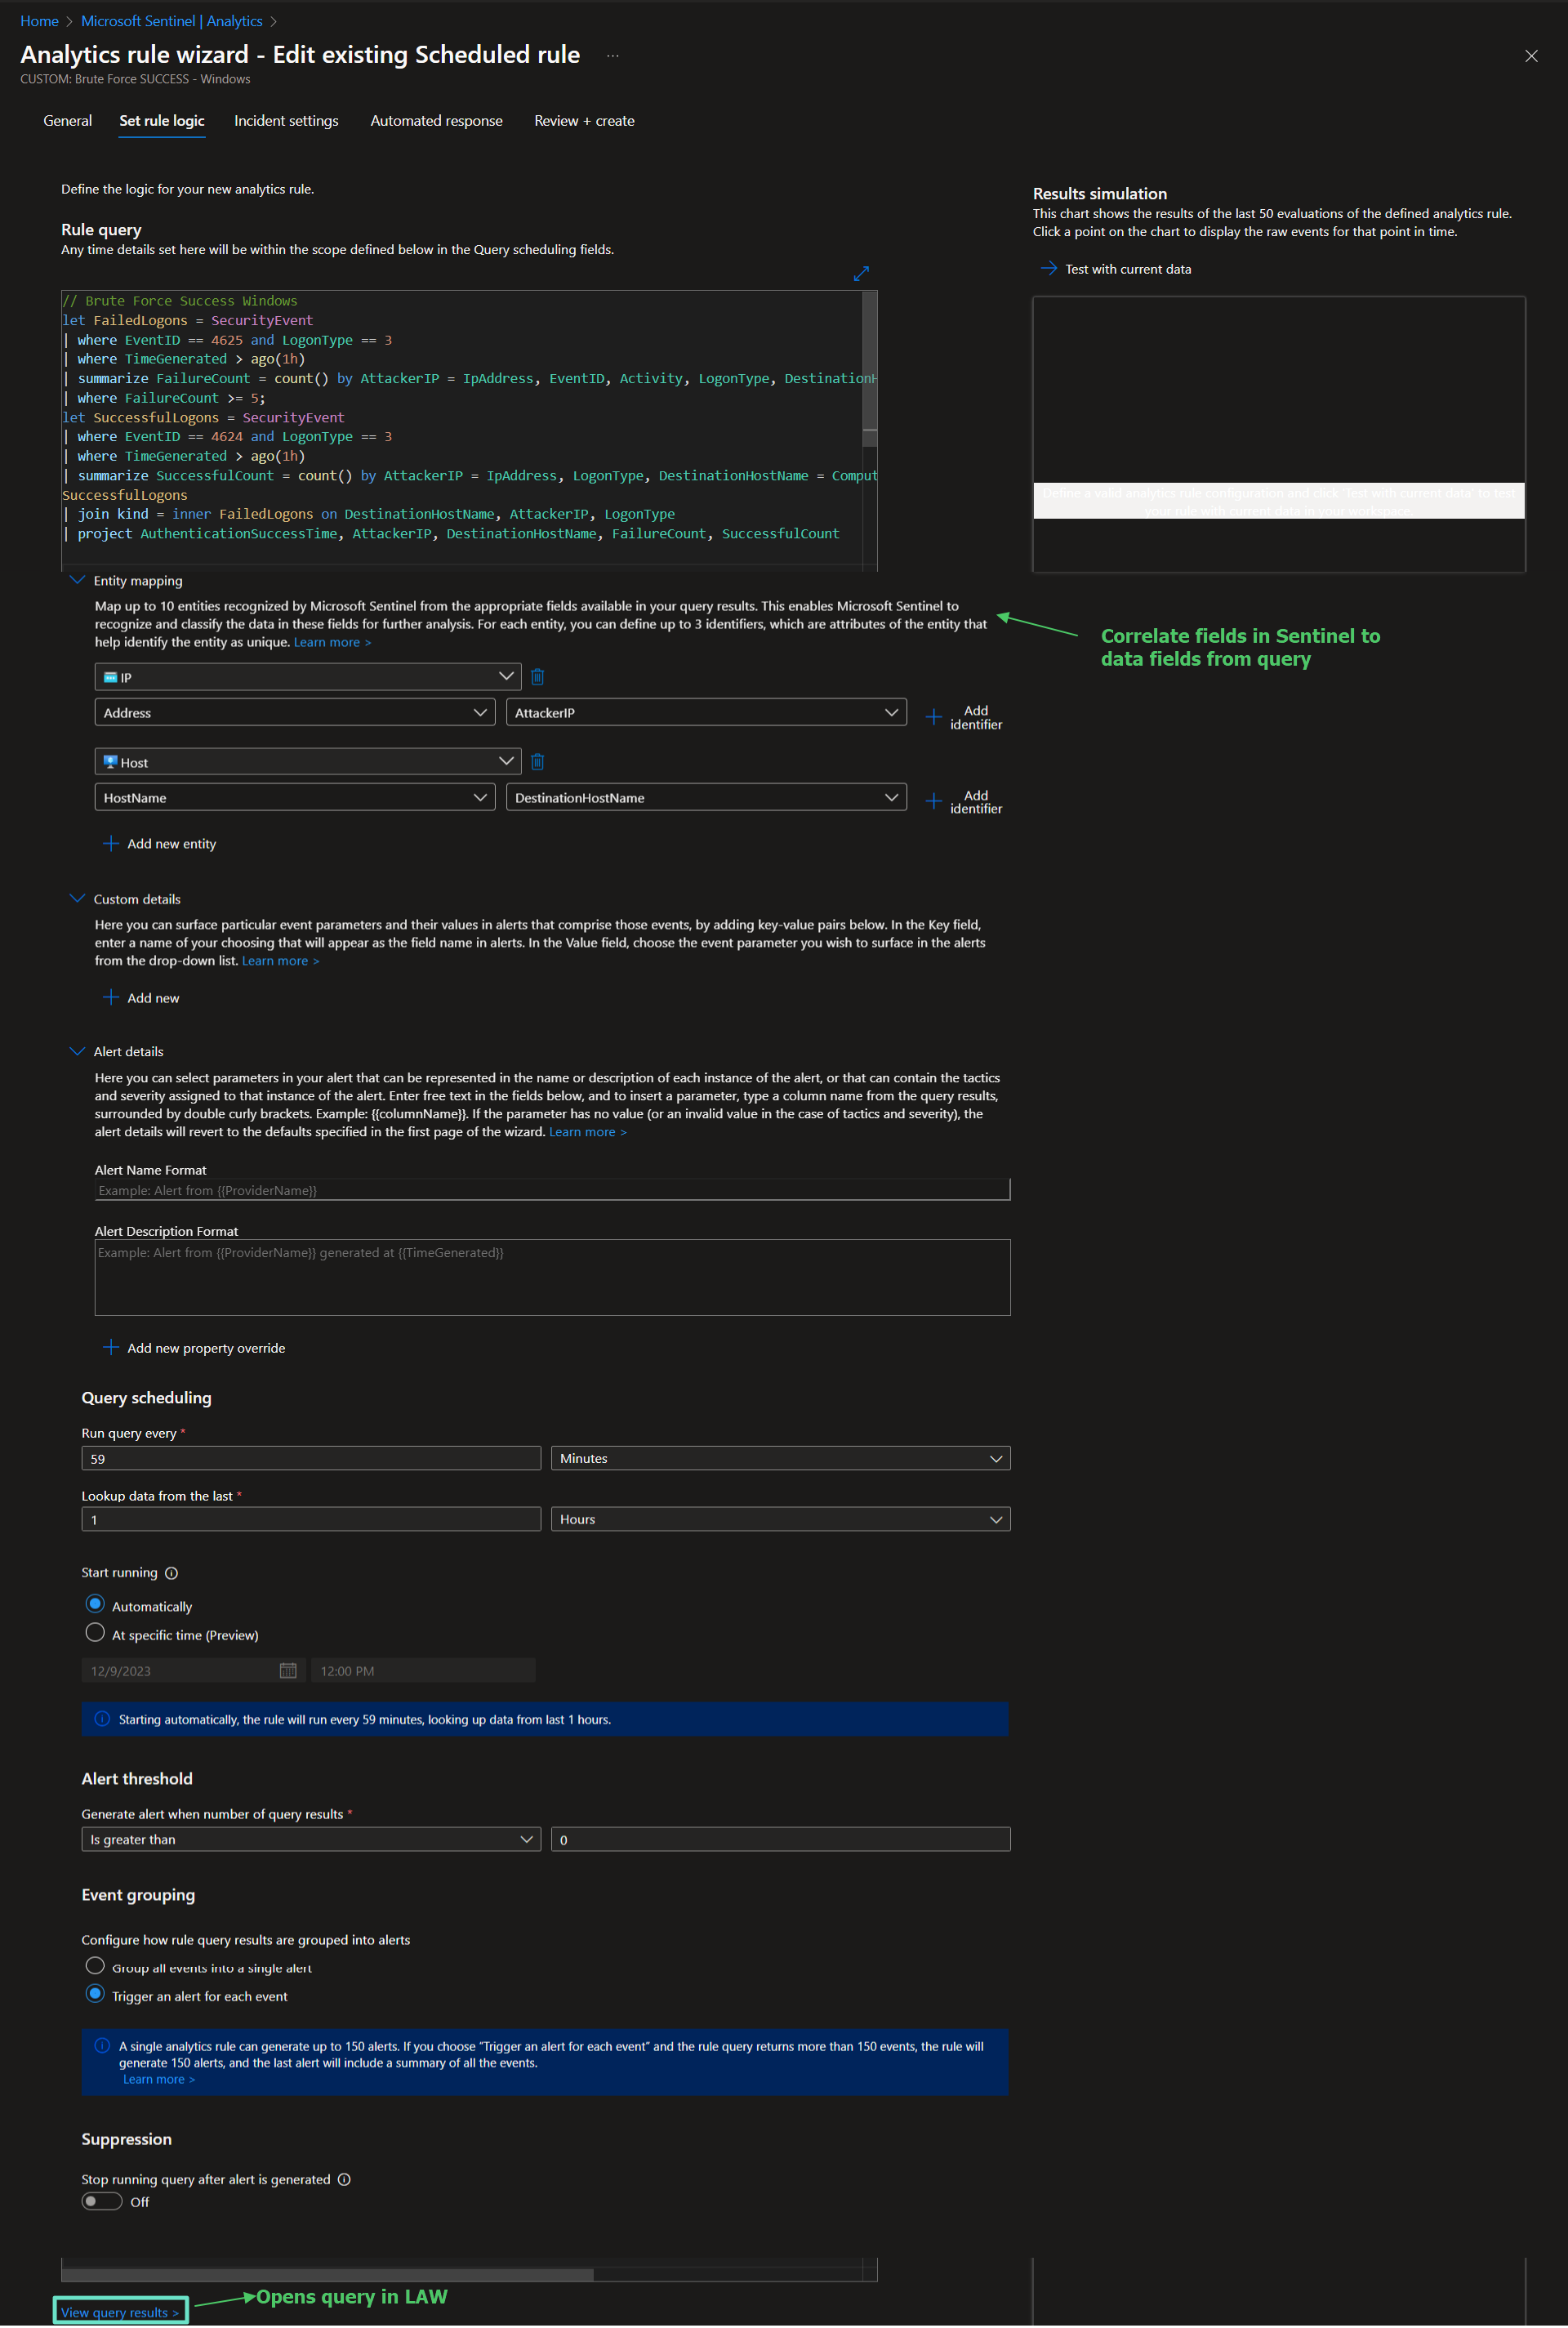
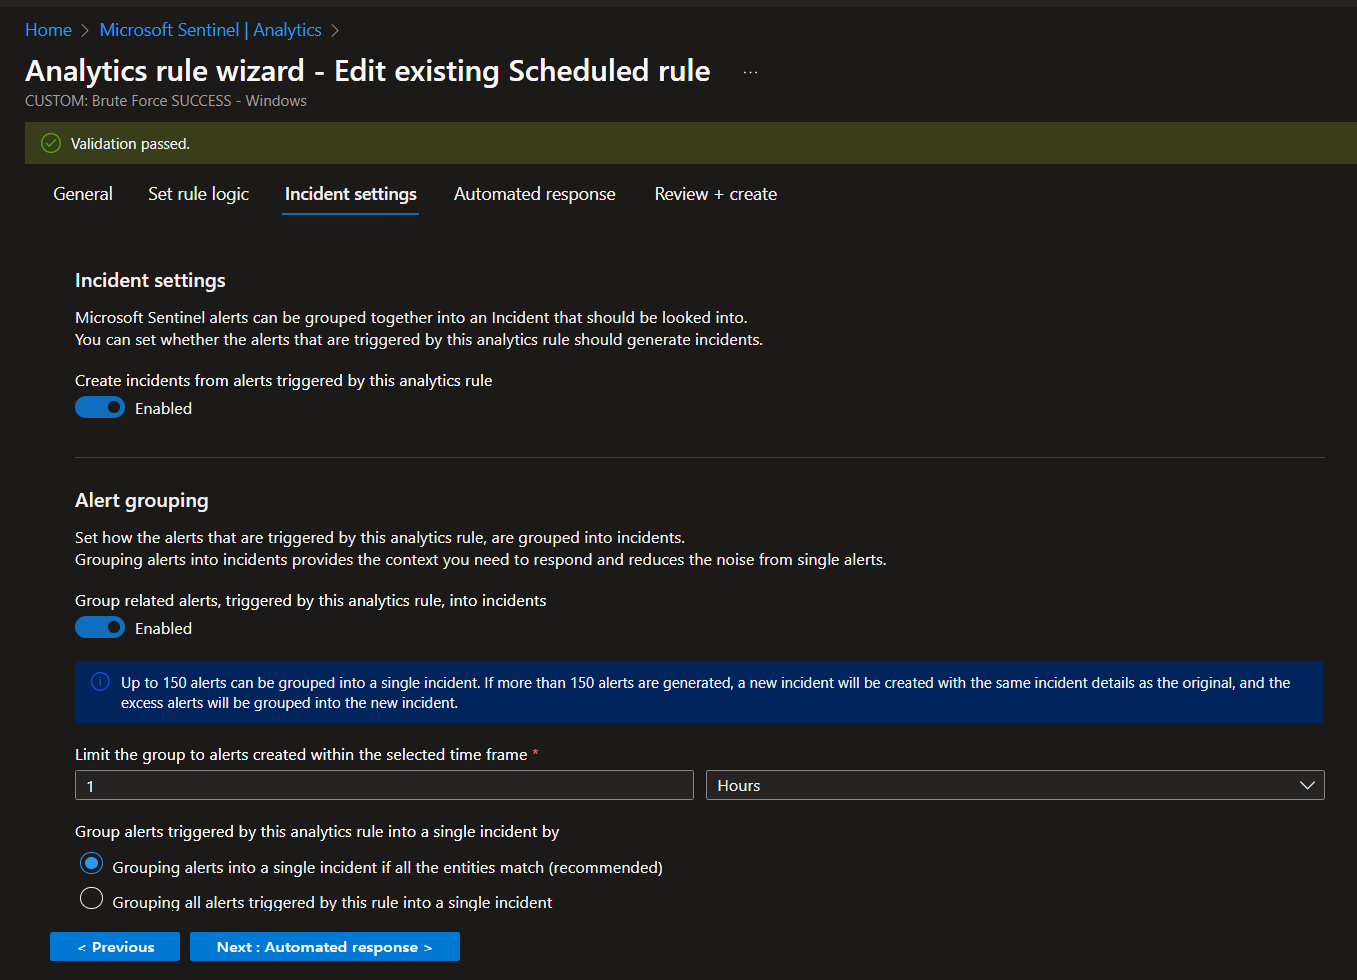
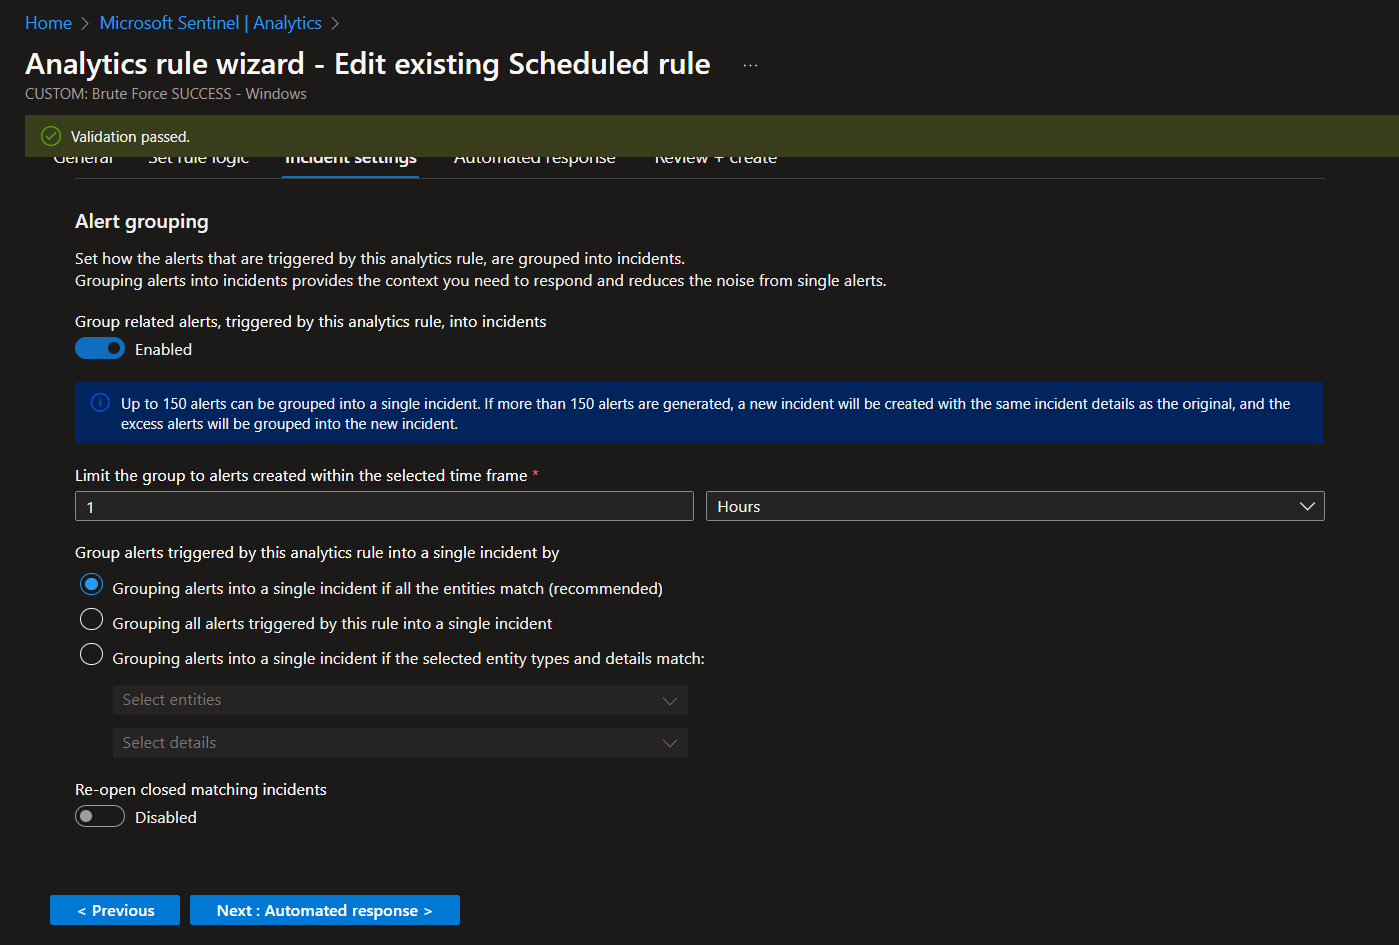
Analytics, Alerting and Incident Generation
Manual Alert Creation
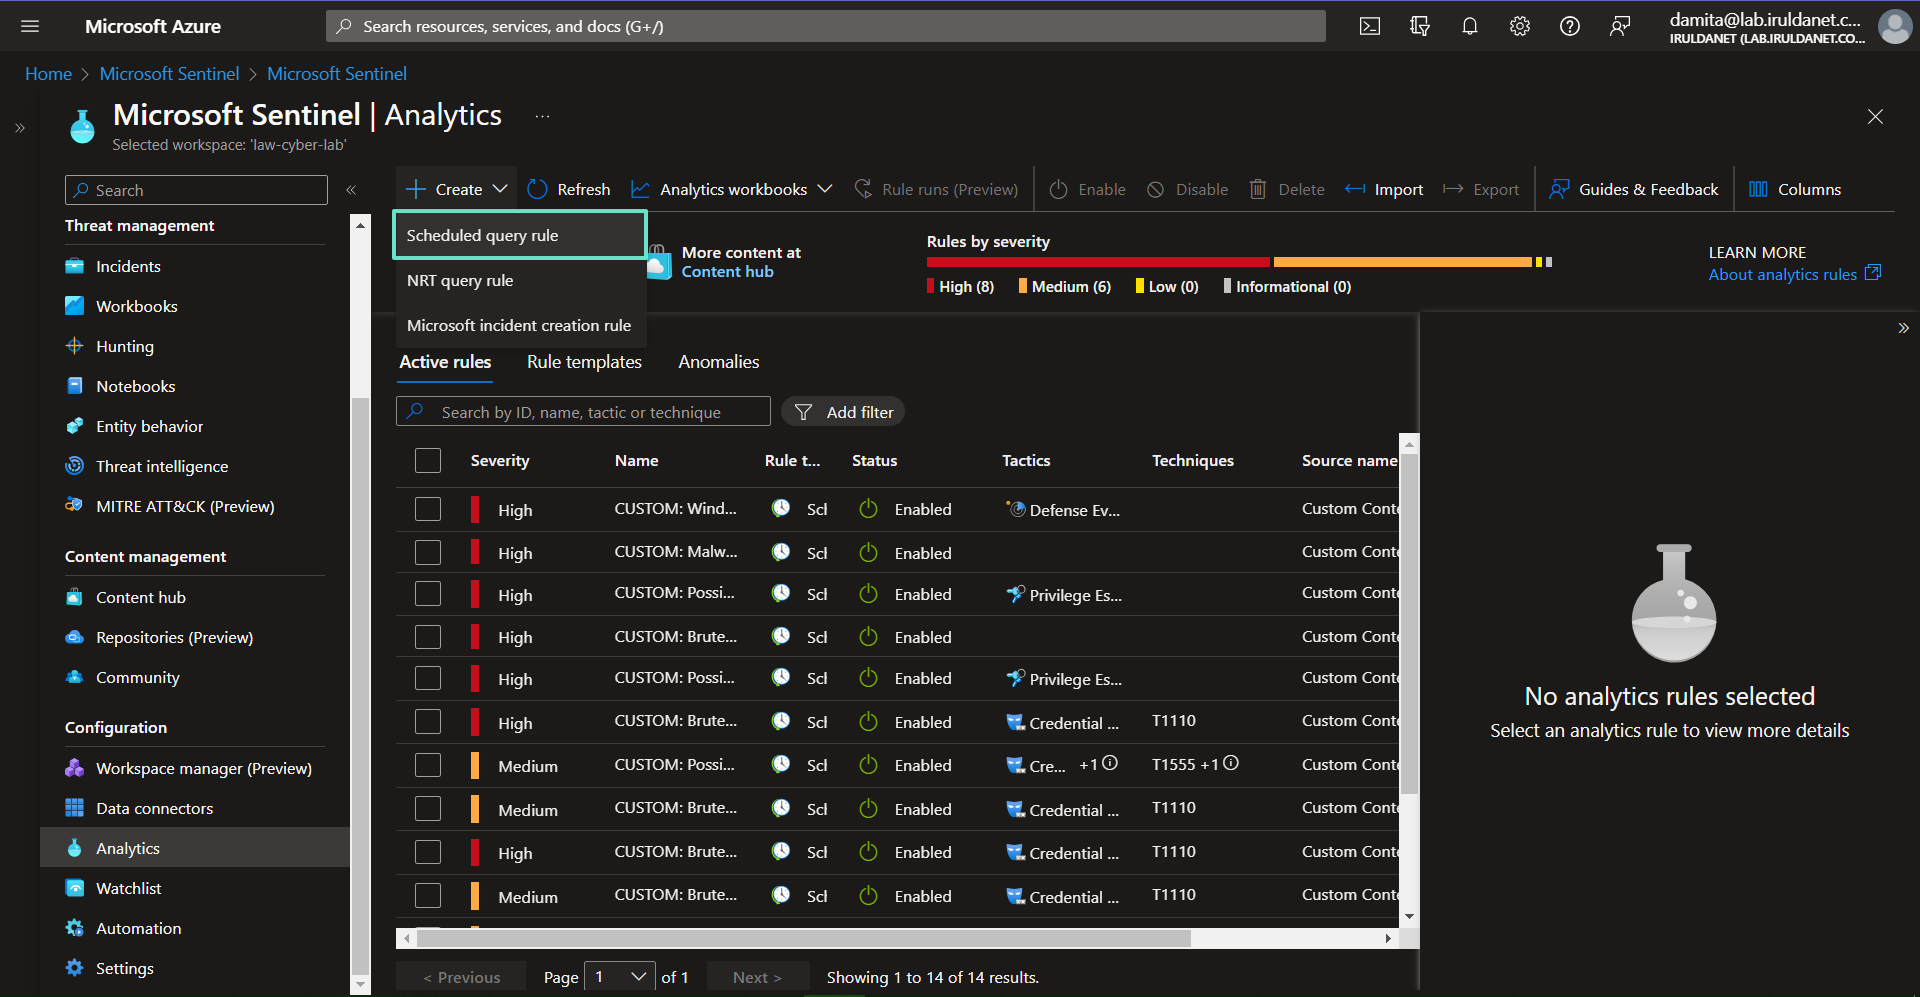
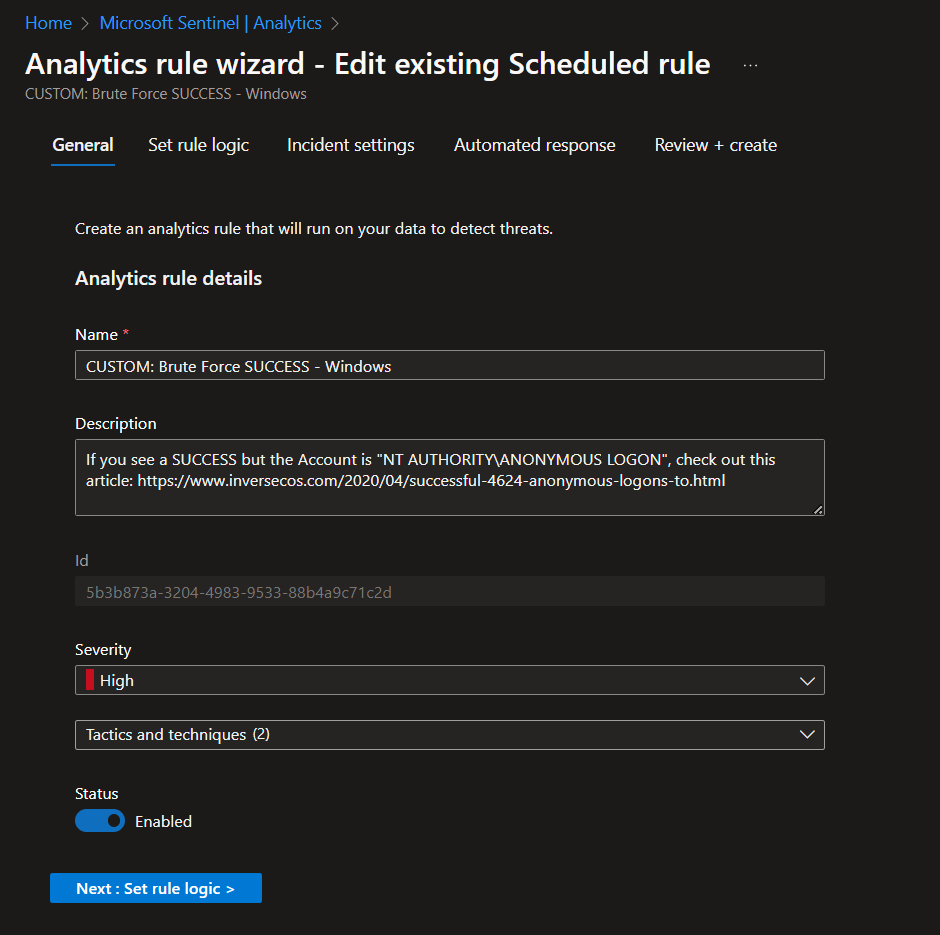
Here we're using KQL queries to trigger alerts and spin up incidents in Microsoft Sentinel.
Sentinel > Analytics > Create scheduled query rule
Attack Traffic Generation (Simulated Attacks)
To test your alerts and incidents rule configuration, simulate some attacks on the VMs and see if they show up in Sentinel (generate alerts and incidents). We have to make sure these work before the first observation period. Here are some tests to run:
- Trigger AAD Brute Force Success: Simulate brute force success against Azure AD with your attacker account (from attack-vm). Either use PowerShell or an incognito window to fail 10-11 consecutive logins, followed by one successful login.
- rigger MSSQL Brute Force Attempt: Using the attack-vm, use PowerShell of SSMS to simulate brute force attempt against your SQL Server by failing 10-11 consecutive logins.
- Trigger Malware Outbreak: In windows-vm generate a malware alert by using PowerShell to create 1 or more EICAR files. You can also do this manually by creating a text file with an EICAR string in it.
- Trigger Possible Privilege Escalation (AKV Critical Credential Retrieval or Update): Manually read Key Vault Secret “Tenant-Global-Admin-Password” in the Azure portal.
- Trigger Windows Host Firewall Tampering: Manually Enable and Disable the windows-vm Firewall.
- Trigger Excessive Password Resets: Reset a users’ password in the Azure portal 10-11 times.
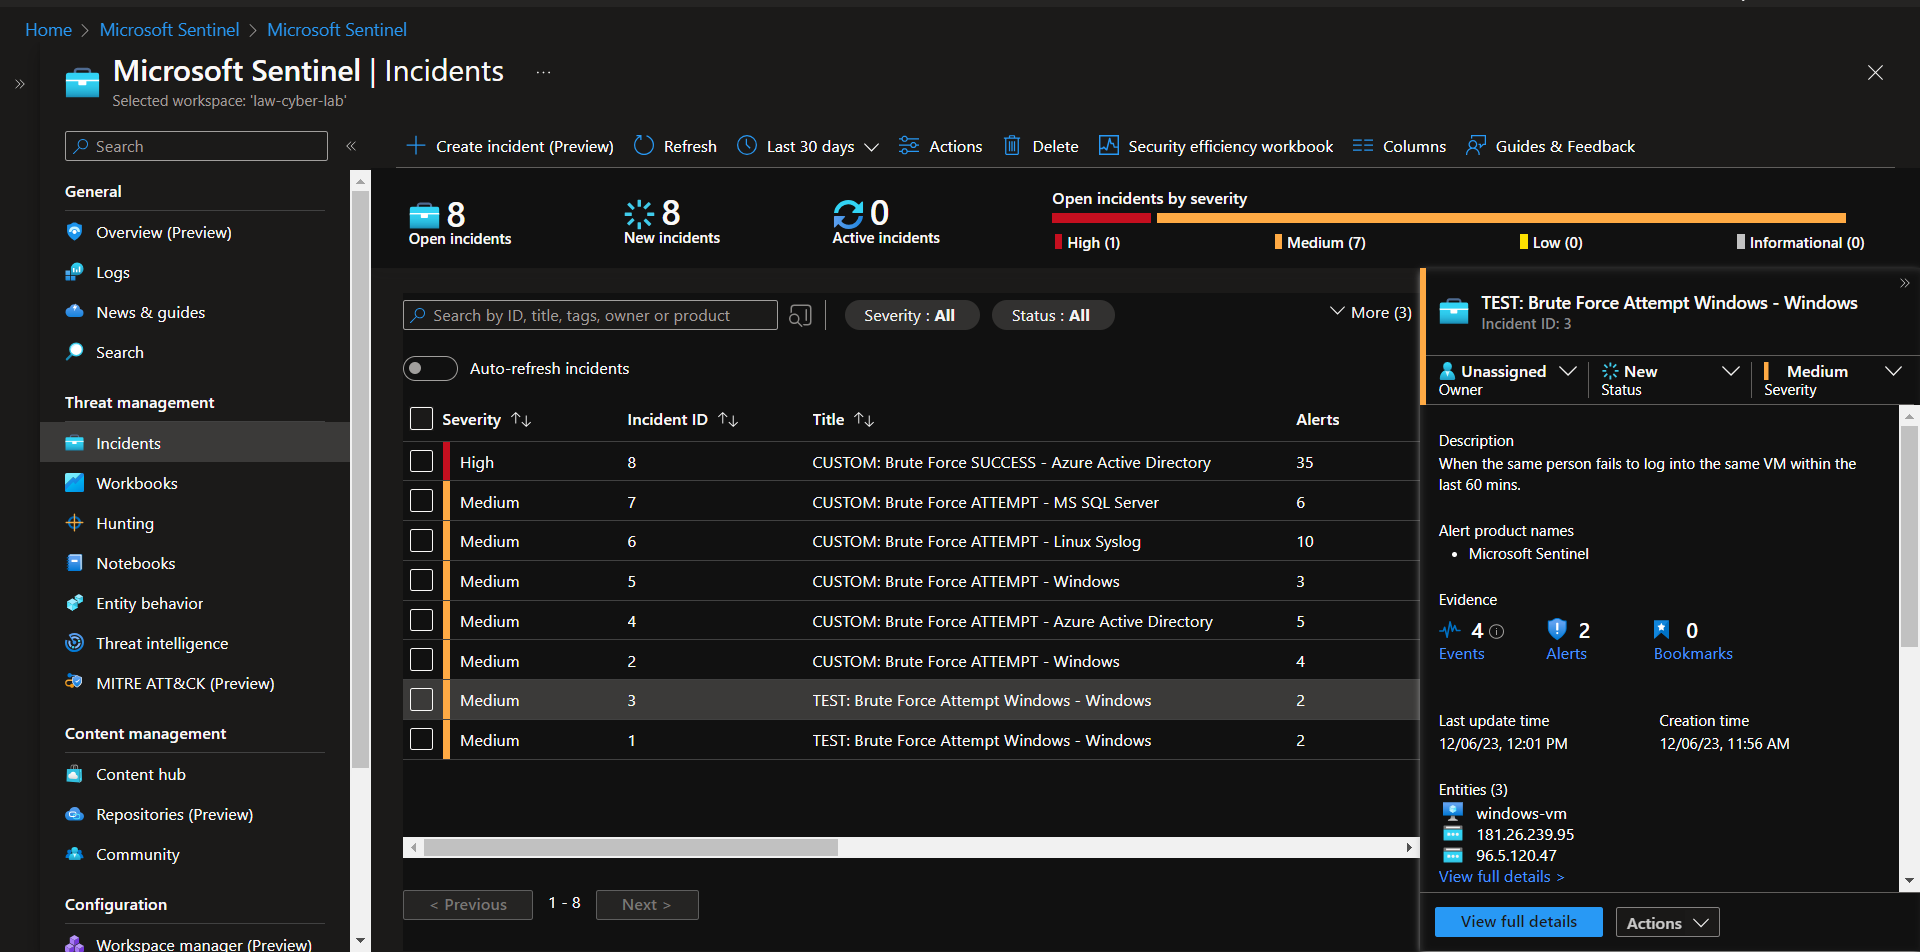
After each attach, wait 10-20 minutes, then check Sentinel to see if you have any incidents. This can also help you with incident investigation later on in the lab.
Incidents in Sentinel after simulating some attacks:
Run Insecure Environment (24H)
The following table shows the measurements taken from the insecure environment after the initial 24 hour observation period:
Metrics - Before Securing Environment
Start Time: 1/18/2024 15:44
Stop Time: 1/19/2024 15:44
| Metric | Count |
|---|---|
| Security Events (Windows VMs) | 29005 |
| Syslog (Linux VMs) | 16562 |
| SecurityAlert (Microsoft Defender for Cloud) | 4 |
| SecurityIncident (Sentinel Incidents) | 204 |
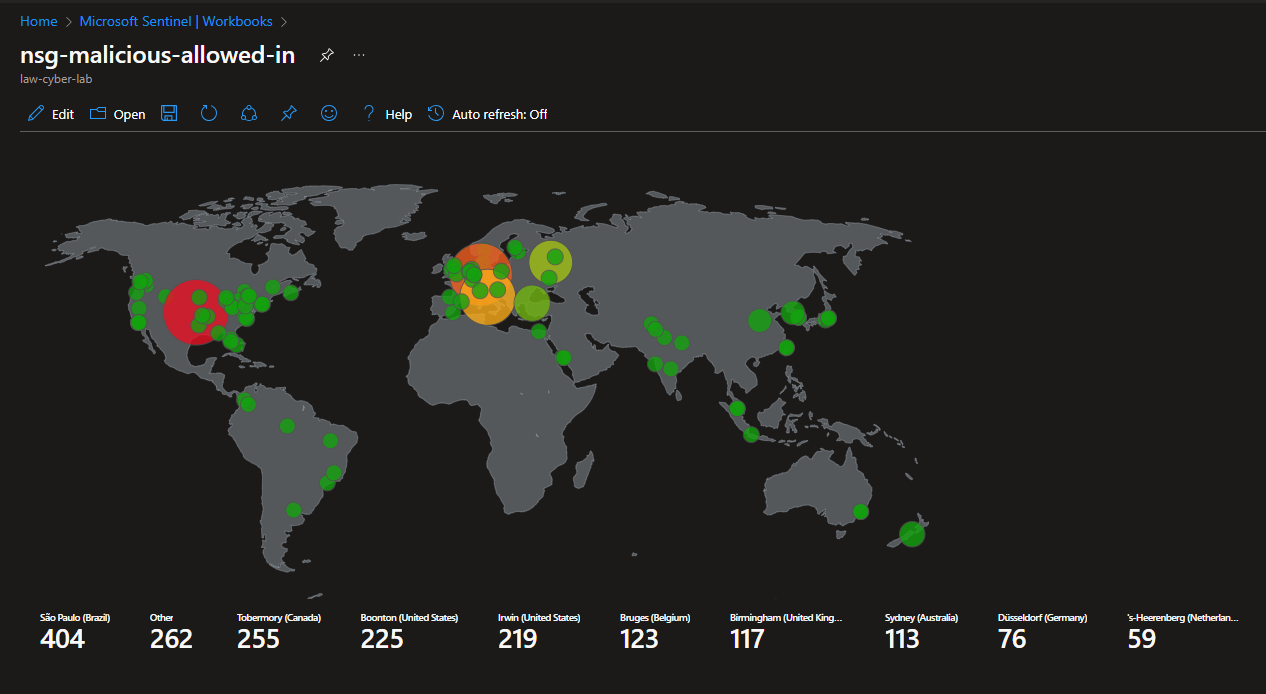
| NSG Inbound Malicious Flows Allowed | 2837 |
Attack Maps Before Hardening / Security
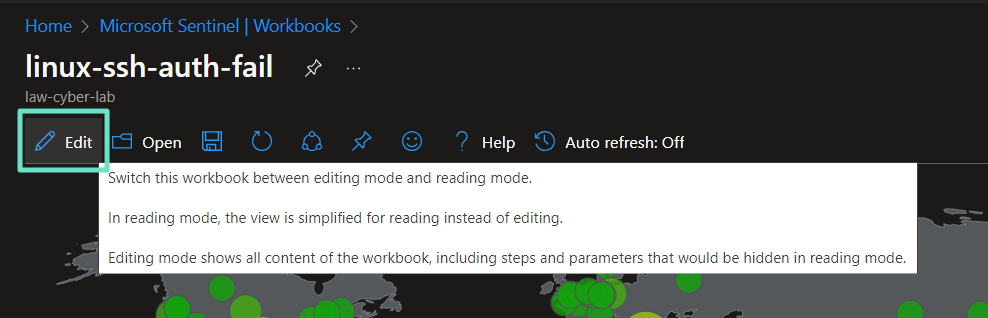
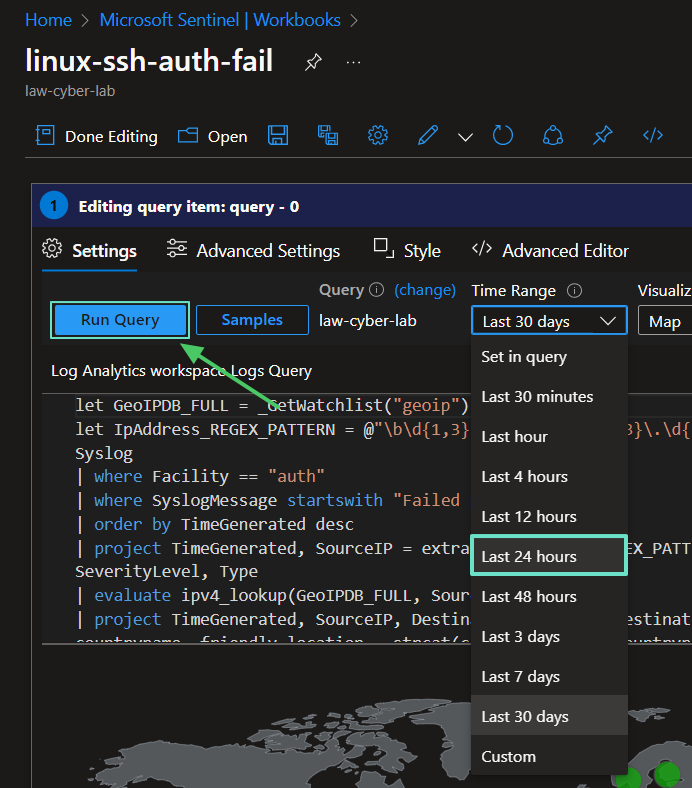
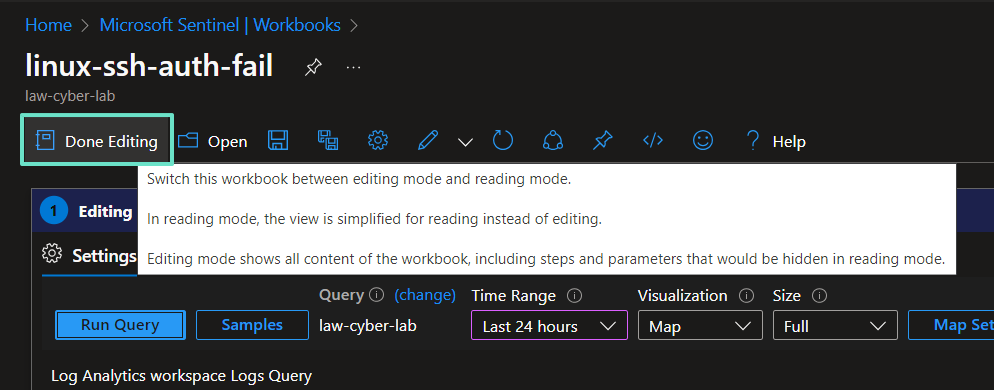
Before taking the screenshots, the workbooks need to be edited to only show the last 24 hours. The query runs over the last 30 days by default.
To edit the maps:

NSG Allowed Malicious Inbound Flows
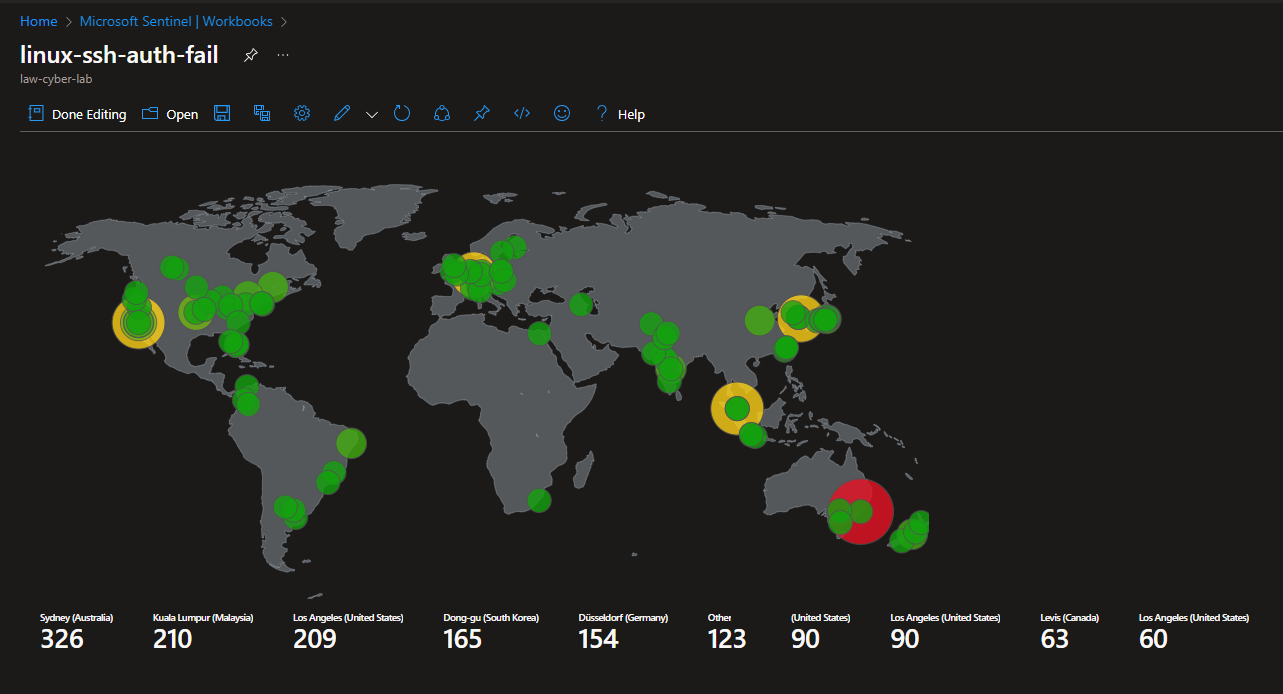
Linux SSH Authentication Failures
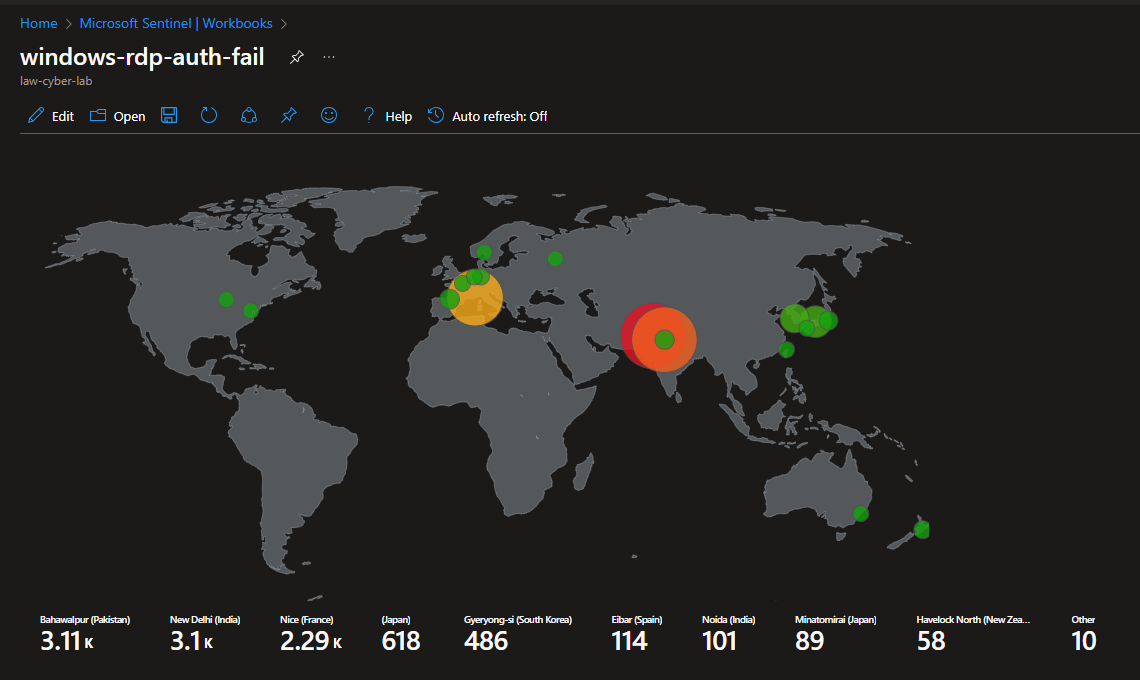
Windows RDP/SMB Authentication Failures
MS SQL Server Authentication Failures